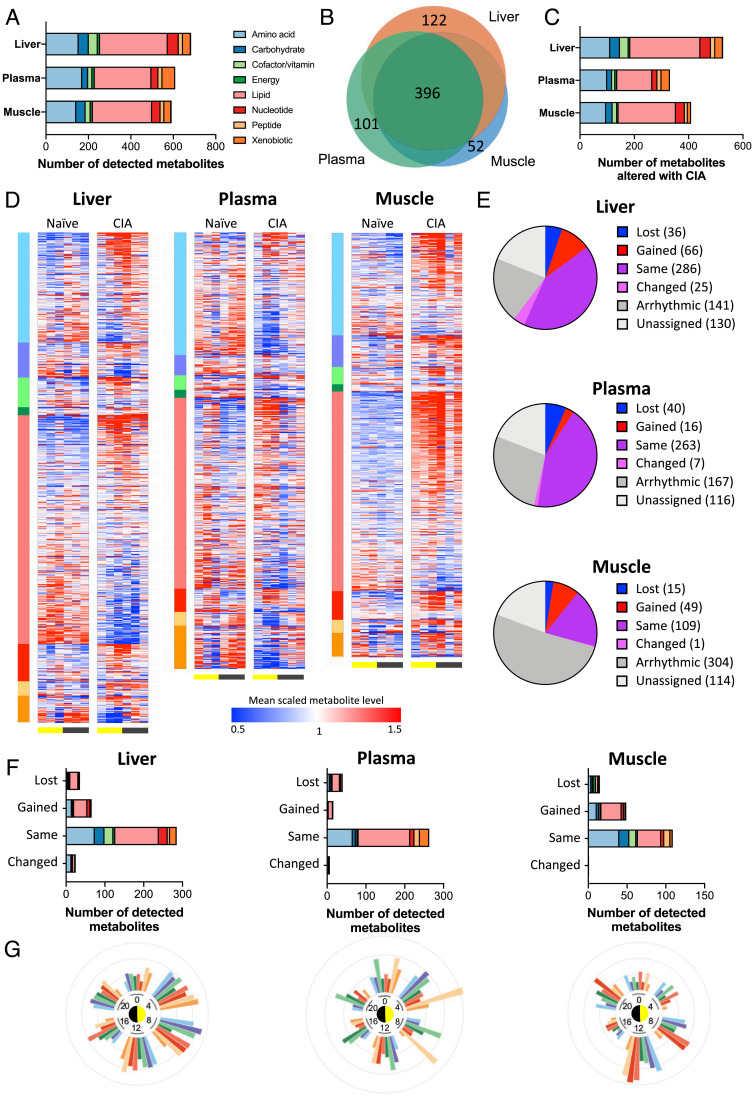
Fig. 5.
The majority of detected metabolites in distal tissues are significantly altered by inflammatory disease. (A and B) Global metabolomic profiling of samples from naïve and CIA mice (n = 5/time per condition) identified overlapping metabolite profiles in liver, plasma, and muscle. Color indicates metabolite superclass of detected metabolites; scale indicates number of identified metabolites. (C) Significant numbers of detected metabolites showed differential abundance with disease (q < 0.05 on two-way ANOVA). (D) Heat maps of tissue-specific metabolite abundance (sorted by metabolite class and then fold change in detection level) represent alterations to metabolite level with disease. (E and F) The effect of distal inflammatory disease on metabolite rhythmicity was categorized using compareRhythms (E) and represented by superclass (F). (G) The proportion of metabolites showing differential detection between naïve and CIA tissue at each time point are presented on radial plots, indicating tissue- and time-specific changes in metabolite abundance with disease.

