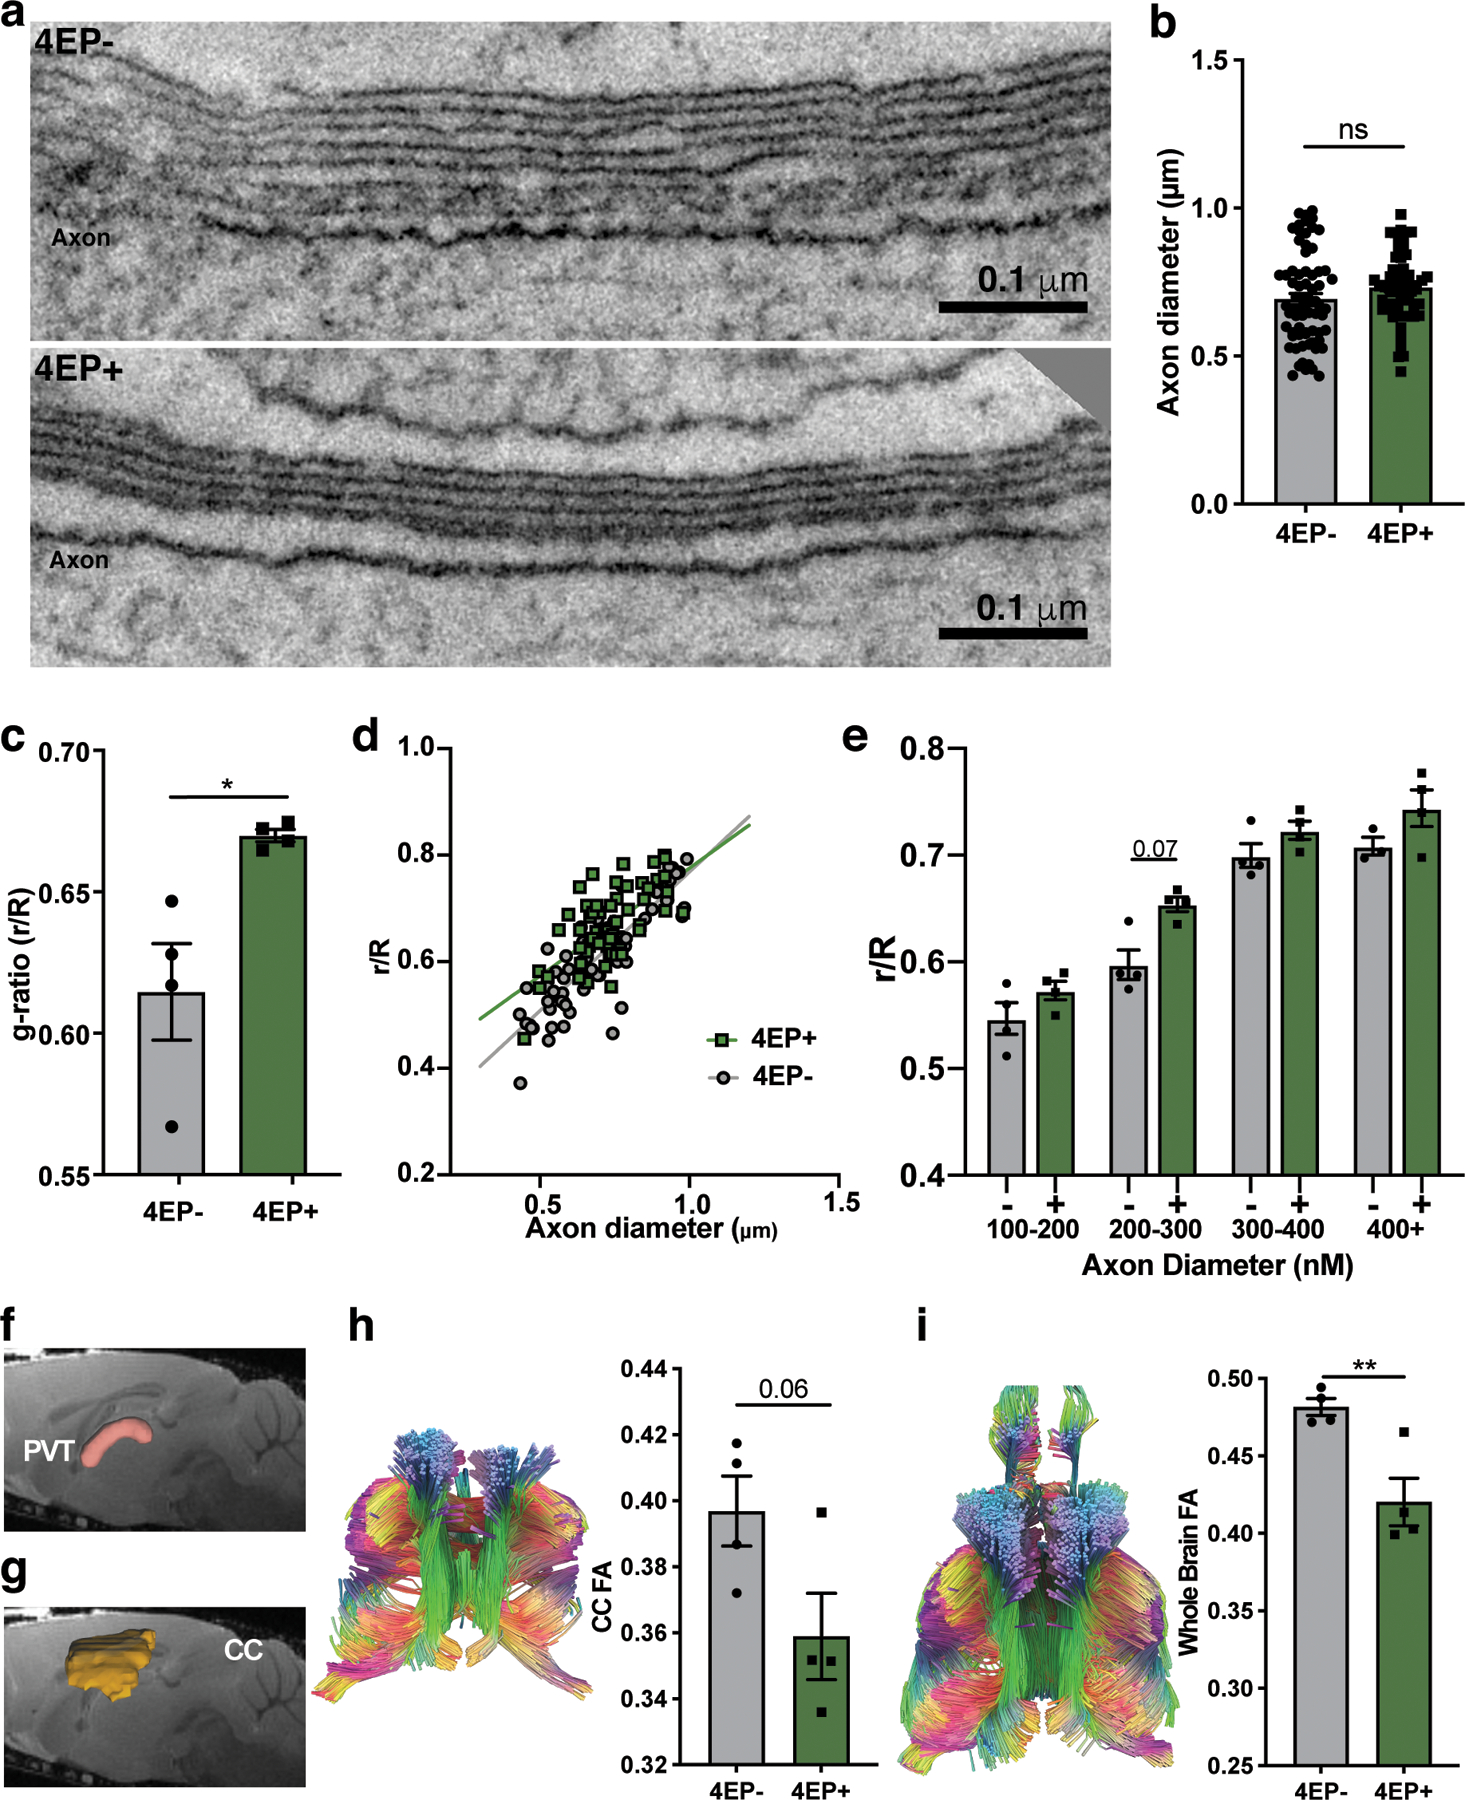
Extended Data Fig. 7. Extended results of myelin analysis by electron microscopy and DTI.

a, Additional ET of myelinated axons in 4EP- (top) and 4EP+ (bottom) mice visualized longitudinally along an axon (n=3; 4 images each). These longitudinal images were used only for qualitative visual assessment of myelin to accompany the other quantitative measures. b, Axon diameters (measured from cell membrane, not including myelin layer) from all axons used to calculate g-ratio (4EP-, 56; 4EP+, 70 axons) (n=4; 4 images each). p=0.1. c, g-ratio (r/R), the inner axon diameter/outer diameter of the myelin sheath, of 4EP+ and 4EP- mice. Each data point represents a mouse (n=4), which is an average of the g-ratio of all axons quantified from 4 images per mouse, where a larger g-ratio indicates a thinner layer of myelin. p=0.046. d, Plot of g-ratio (r/R) on the y-axis and axon diameter on the x-axis, with linear regression noted by lines (4EP-, 56; 4EP+, 70 axons) (n=4; 4 images each). e, Average g-ratio of each animal, binned by axon size, indicating that mid-sized range of axons are driving the change in overall g-ratio phenotype observed in the mice (n=4). f-g, Defined regions of interest for the PVT and corpus callosum (CC) overlaid on representative sagittal MRI image. h-i, representative tracts observed from a bilateral coronal plane view (left) and fractional anisotropy (FA) analysis (right) for the corpus callosum (CC), and whole brain (p=0.009), respectively (n=4). Two independent trials using multiple litters were used for experiments in this figure. Data represent mean ± SEM. Statistics were performed using two-tailed Welch’s t-tests (b,c,h,i), simple linear regression test (d), or one-way ANOVA with Dunnett multiple comparison between 4EP+/− groups at each size group. * p ≤ 0.05; ** p ≤ 0.01.
