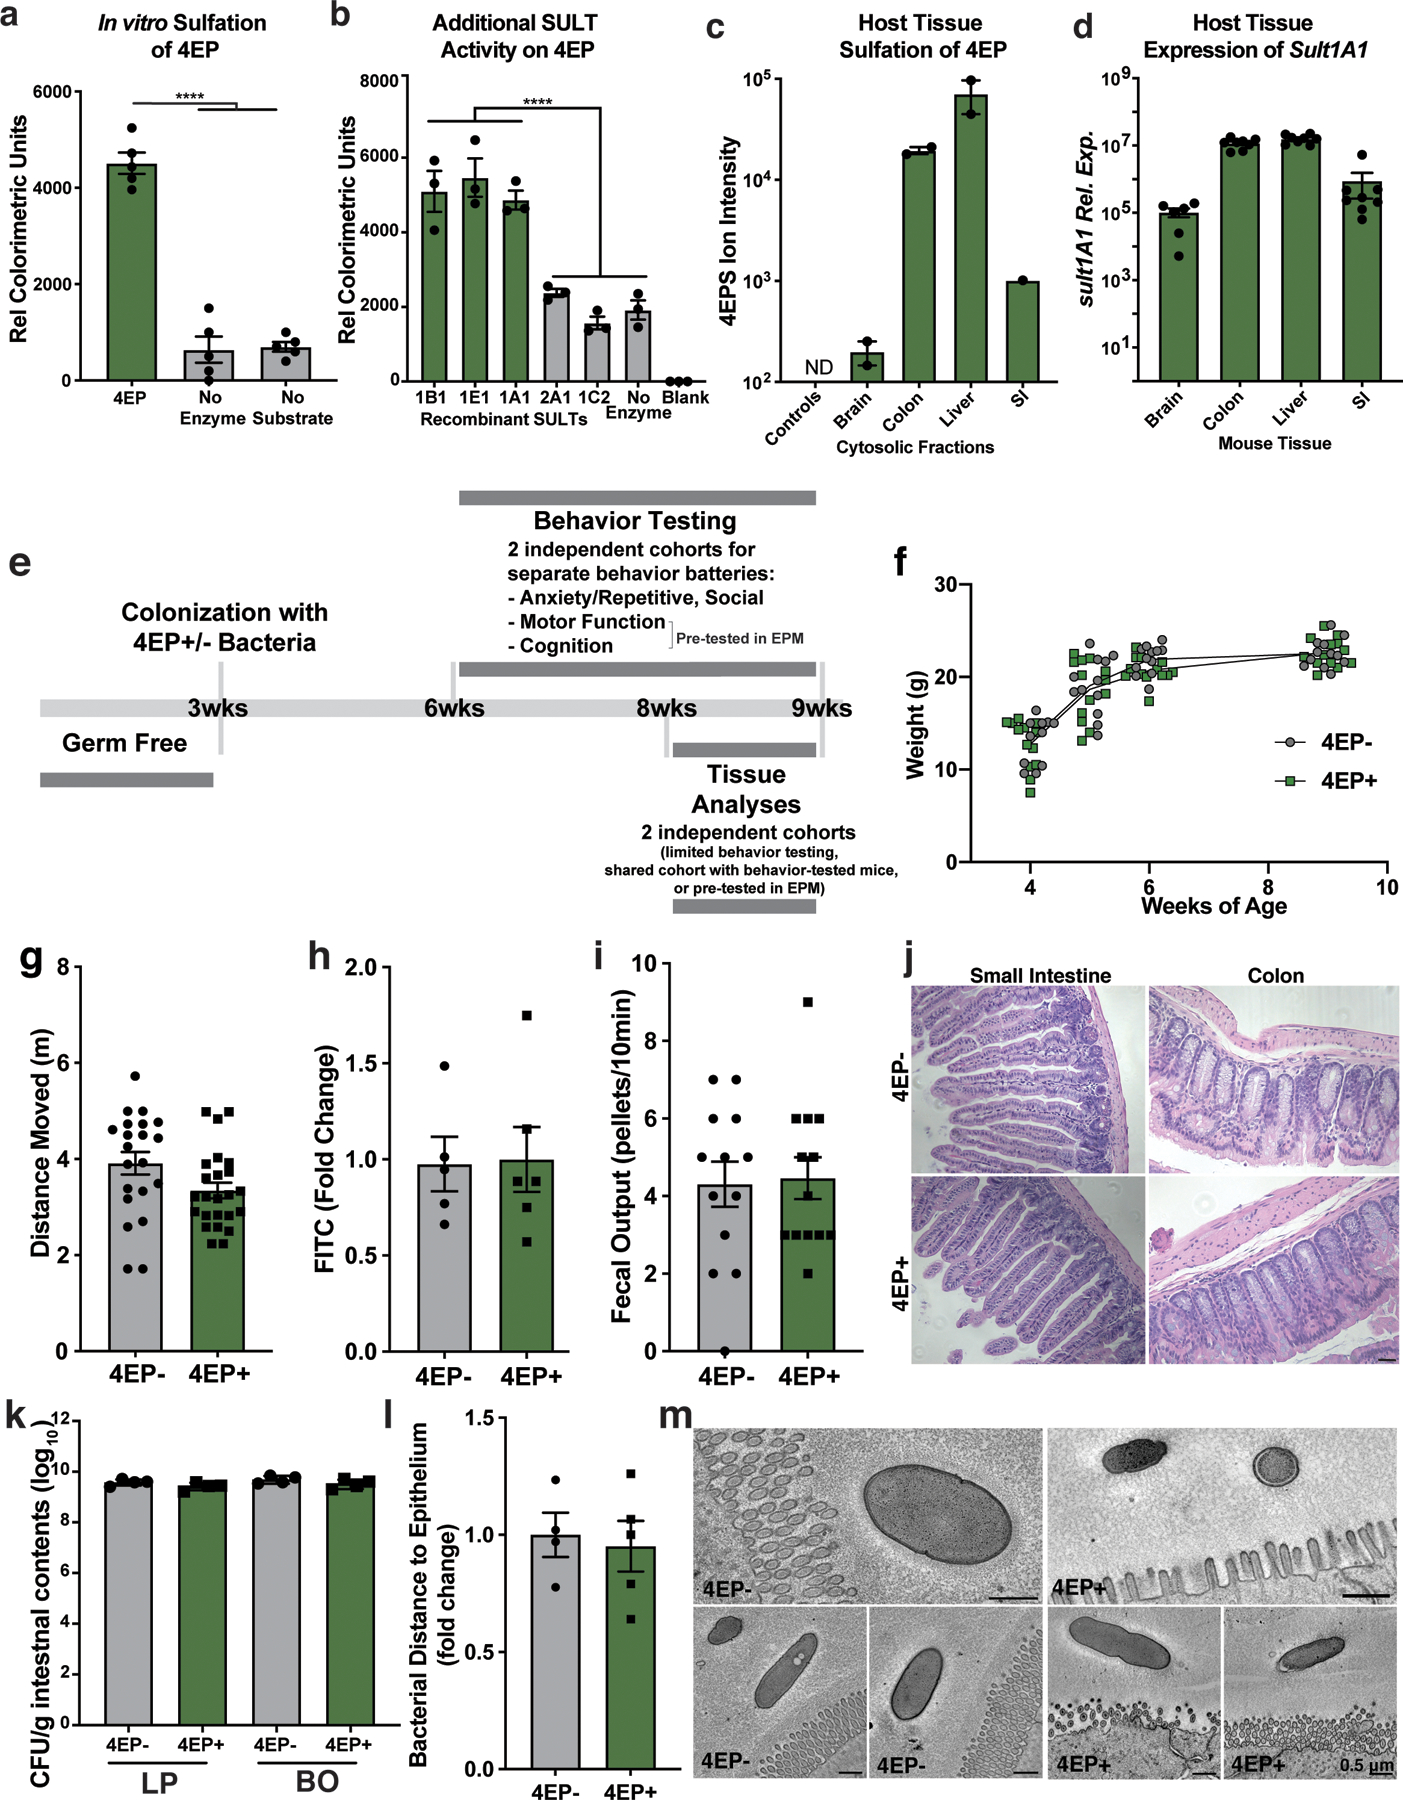
Extended Data Fig. 2. 4EP sulfation, experimental timeline, normal weight gain, colonization and intestinal barrier of 4EP+ mice.

a, In vitro recombinant SULT1A1 sulfotransferase assay with 4EP as potential sulfate acceptor (n=5)p<0.0001. b, Results of the sulfotransferase assay using various recombinant SULTs (n=3)p<0.0001. c, 4EP sulfation capacity of cytosolic fractions of brain, colon, liver, and small intestinal tissue, each containing endogenous sulfotransferases (n=2 datapoints of samples pooled from triplicate biological replicates, with only 1 pool for SI). Ion intensity of 4EPS measured by LCMS is plotted along the y-axis. d, Confirmation of expression of the Sult1a1 gene measured by qPCR in tissue from the brain, colon, liver, and small intestine of colonized mice (n=8; brain n=6)p<0.0001. e, Schematic of mouse experimental timeline, showing ages of mice at colonization of GF mice with 4EP+/− strains, behavior testing and tissue collection. f, Weights of mice (grams) after colonization of GF mice with 4EP- or 4EP+ bacteria (n=13). g, Ambulatory activity of 4EP- and 4EP+ mice over ten minutes, measured by distance moved when mice were placed in an open arena and allowed to explore (4EP- n=21; 4EP+ n=24). h, FITC-dextran levels in serum as a measure of intestinal permeability (4EP- n=5, 4EP+ n=6). i, Fecal output of colonized mice over 10 minutes (n=13). j, Images of hematoxylin and eosin (H&E) stained small intestine and colon of 4EP+/− mice (representative images of n=4). Scale bar 50μm. k, Colonization of ex-GF mice with engineered Bacteroides ovatus (BO) and Lactobacillus plantarum (LP), plotted as colony forming units (CFU) per gram of intestinal contents (n=4). l, Quantification of bacterial distance from the intestinal epithelium imaged by electron tomography, where each data point represents a separate animal comprised of an average of 5–10 bacterial cells per image per mouse (4EP- n=4; 4EP+ n=5). m, Example images of bacterial cells near the intestinal epithelial layer of 4EP+/− mice. Two independent trials using multiple randomized litters were used for the experiments in the figure. Abbreviations: SULT, sulfotransferase; SI, small intestine. Data represent mean ± SEM. Panel f was analyzed by a 2-way ANOVA with a Bonferroni multiple comparison correction. Panels g-i and l were analyzed using two-tailed Welch’s t-tests and panels a-d, k by a one-way ANOVA with Dunnett multiple comparisons test.
