Fig. 4.
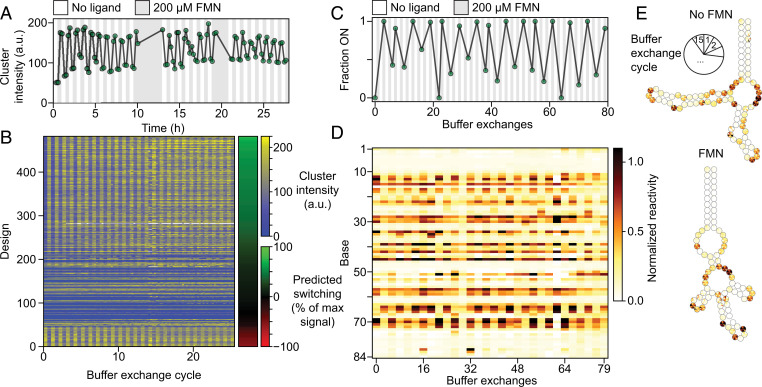
Reversible switching of RNA switches (A) Fluorescence signal in arbitrary units (a.u.) from the top-scoring single-aptamer design as the FMN concentration is repeatedly toggled from 0 (white) to 200 µM (gray). Signals from up to 112 individual clusters were averaged. (B) FMN switches from the same experiment in A ordered by predicted switching magnitude and direction (right bar). Bottom constructs are predicted to switch in the opposite direction (red color in the right bar). (C) Switch behavior across 80 buffer exchanges as probed by chemical mapping (dimethyl sulfate probing carried out on aliquots after approximately every third exchange, as indicated by the green points in the graph). (D) Reactivity per base for the aptamer profiled in C (each point in C corresponds to a column in D). (E) Reactivity per base mapped onto predicted secondary structures. Each base is divided into 15 segments corresponding to each time point.

