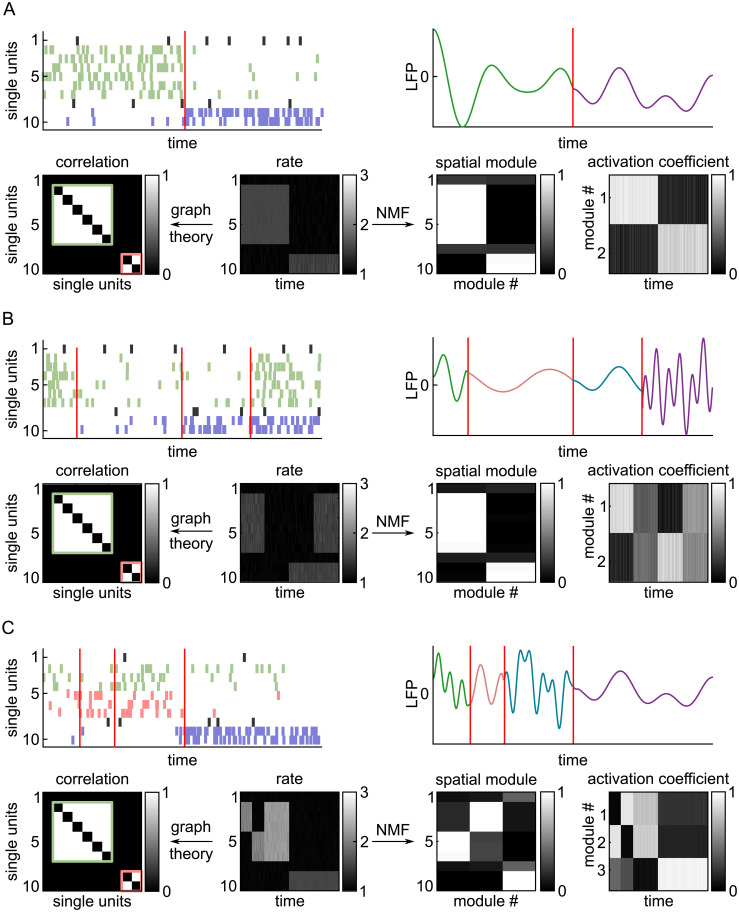
Fig. 1.
Comparison of NMF versus graph theoretic analysis for detecting ground truth ensemble dynamics from synthetic spike trains. Three different simulated spike rasters were generated to compare the NMF method with the graph theoretic method. (A) Scenario 1 (two ensembles active at distinct times). (B) Scenario 2 (two ensembles active at distinct and overlapping times). (C) Scenario 3 (three ensembles active at distinct and overlapping times). Top Left, Simulated spike rasters of 10 single units. The spikes belonging to different ground truth ensembles are in different colors. The red lines indicate transitions in the population activity. Top Right, Simulated ongoing cortical LFP with different cortical states plotted in different colors. Bottom Middle, Binned spike rates of each unit. Bottom Left, Neuronal groups detected by graph theoretic analysis of time-averaged pairwise correlations. White indicates a significant time-averaged correlation for the pair defined by each axis. Groups of coactive neurons are indicated by the green and red boxes ( SI Appendix, Materials and Methods ). Bottom Right, NMF decomposition into the spatial modules and their activation time courses.

