Fig. 1.
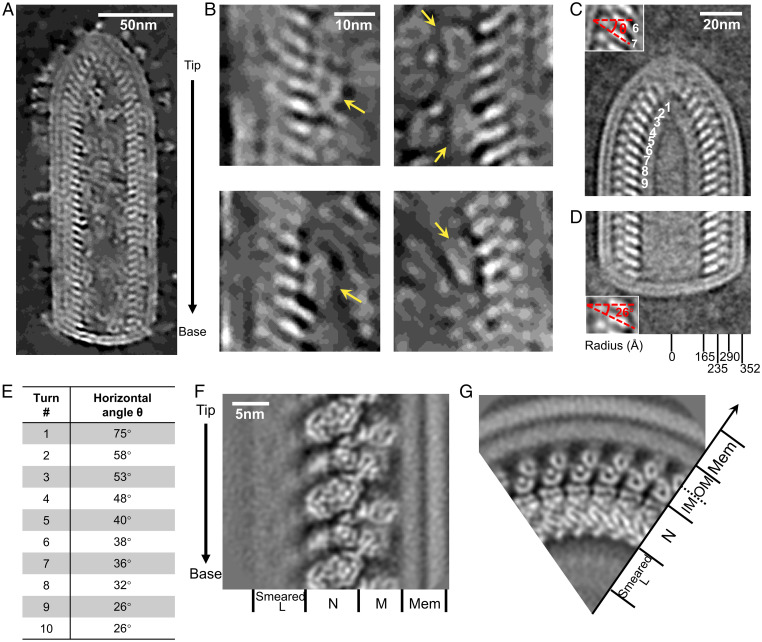
Architecture of VSV virions resolved by cryoET. (A) A slice through a denoised tomogram showing a section of a representative VSV virion. The arrow on the right denotes the directionality of the virion. (B) Representative L attached to N. Yellow arrows indicate the attached L molecules. (C) A subtomogram averaged density map of VSV conical tip from 88 virions. Inset: zoom in view of layers 6 and 7, with red lines indicating the inclination (horizontal angle θ) of N subunits. (D) A subtomogram averaged density map of VSV blunt base from 90 virions. Inset: zoom in view of two layers, with red lines indicating the inclination of N subunits. (E) Horizontal angles of different helical turn layers in the conical tip in (C). (F) A subtomogram averaged density map of VSV M-N in the trunk. Different proteins of VSV are indicated at the bottom. The arrow on the left indicates the direction from tip to base. (G) The top view of (F), showing radial positions of different VSV proteins. Two layers of M subunits bridge the N layer and the membrane.

