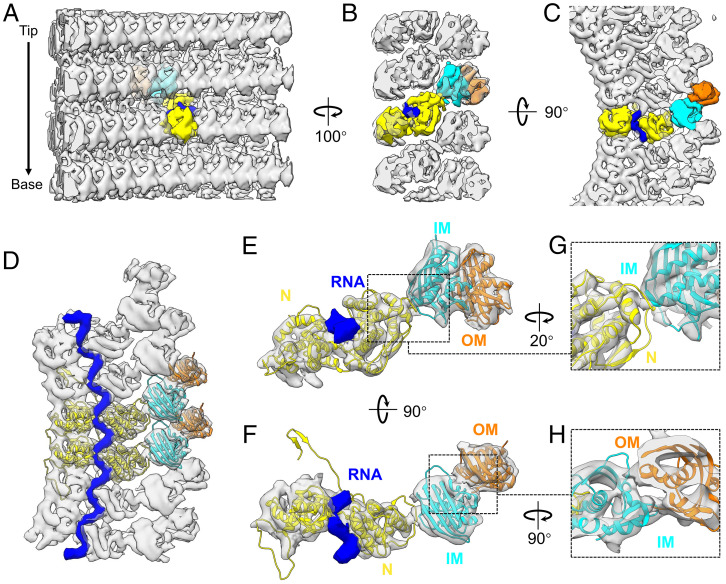
Fig. 2.
Subtomogram averaged structure of proteins M, N, and genomic RNA. (A–C) Three roughly orthogonal surface views of the structure of VSV M-N determined by subtomogram averaging, as viewed from inside (A), side (B) and top (C) of the virion. For ease of visualization, one subunit in each layer is colored: yellow is N, cyan is IM, orange is OM, and blue is a fragment of genomic RNA bound with one N molecule. (D) Top view of the averaged density (semitransparent gray) of six asymmetric units from the same helical turn, with two asymmetric units fitted with the crystal structures (ribbon) of N (PDB: 2GIC) (12) and M (Protein Data Bank [PDB]: 1LG7) (31). The encapsidated RNA is in blue. (E and F) A segmented asymmetric unit of the averaged density (semitransparent gray) fitted with same crystal structures (ribbon), viewed from side (E) and top (F). The cryoEM densities corresponding to the atomic models of the N-arm and the C-loop of N are not included due to insufficient resolution needed for segmentation, since they interact with and are mixed within the densities of neighboring subunits. (G) Detailed view of the interface between N and IM. (H) Detailed view of the interface between IM and OM.

