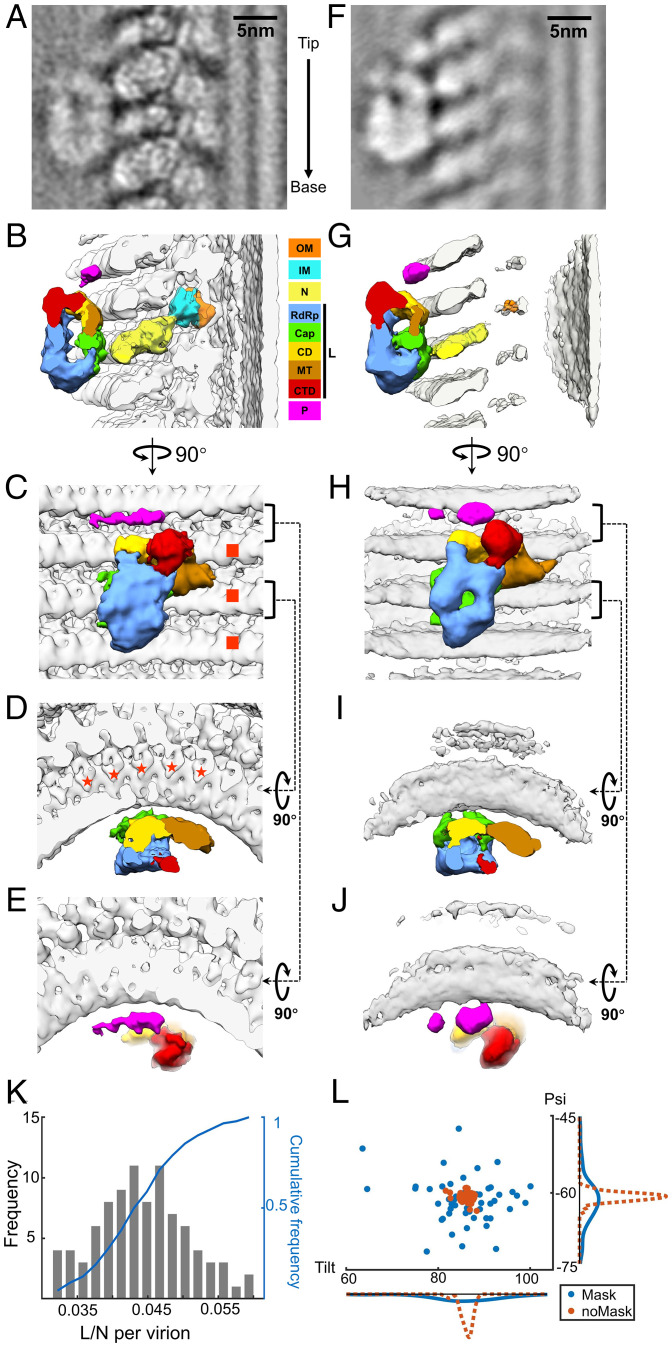
Fig. 3.
Subtomogram averaged structure of VSV polymerase complex flexibly attached to N. (A) An averaged density map of VSV polymerase L refined without mask around L molecules. The arrow on the right indicates the direction from tip to base. (B–E) 3D segmentations of VSV OM, IM, N, L, and P viewed from side (B), inner (C) and top views (D and E). The interactions of L with N are located between N and the capping domain (Cap) of L. The footprint of an L molecule is across three helical turns of N (marked by red squares in C) and five subunits in each turn (marked by red stars in D). (F) An averaged density map of VSV polymerase L refined with mask around L molecules. N and M subunits are smeared due to the masking around L during subtomogram averaging. (G–J) 3D segmentations of VSV OM, IM, N, L, and P viewed from side (G), inner (H), and top views (I and J). Domains and proteins are colored the same as (B–E). (K) The histogram and cumulative frequency plot of the ratio of L molecules to N molecules per virion (trunk). (L) Distributions of tilt and psi angles of subtomograms from one representative virion. Red: the average without mask; blue: the average with mask. Bottom: frequency distribution of tilt angles; Right: frequency distribution of psi angles. Color keys for OM, IM, N, P, and different domains (following those in ref. 26) of L are shown between panels B and G.

