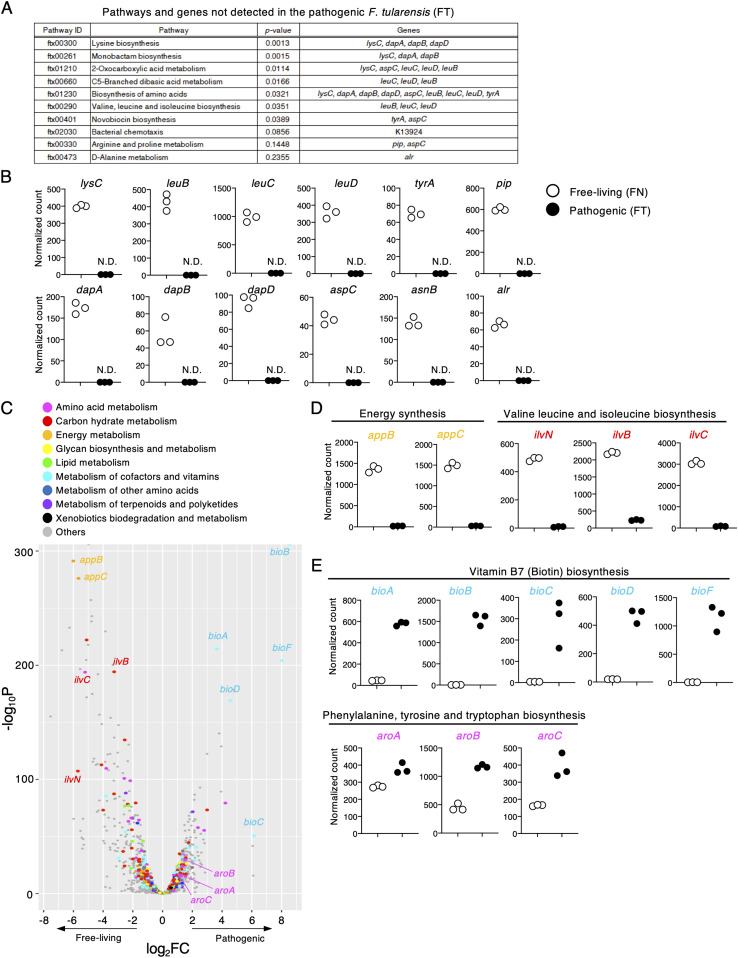
Figure 1. FT has unique metabolic programs.
RNA sequencing of free-living and pathogenic F. tularensis strains. (A) The top 10 pathways expressed in the free-living (FN) but not the pathogenic strain (FT) were calculated by Fisher’s exact test. A total of 148 genes were detected only in the free-living strain and were used for this analysis. (A, B) Plots of normalized counts of each gene noted in (A) in both strains. (C) Volcano plot analysis of 1,229 genes detected in both the pathogenic and free-living strain. X- and y-axis show the log2FC and log10P-values, respectively. (D, E) Plots of the normalized read counts for genes down-regulated (D) or up-regulated (E) in the pathogenic strain.

