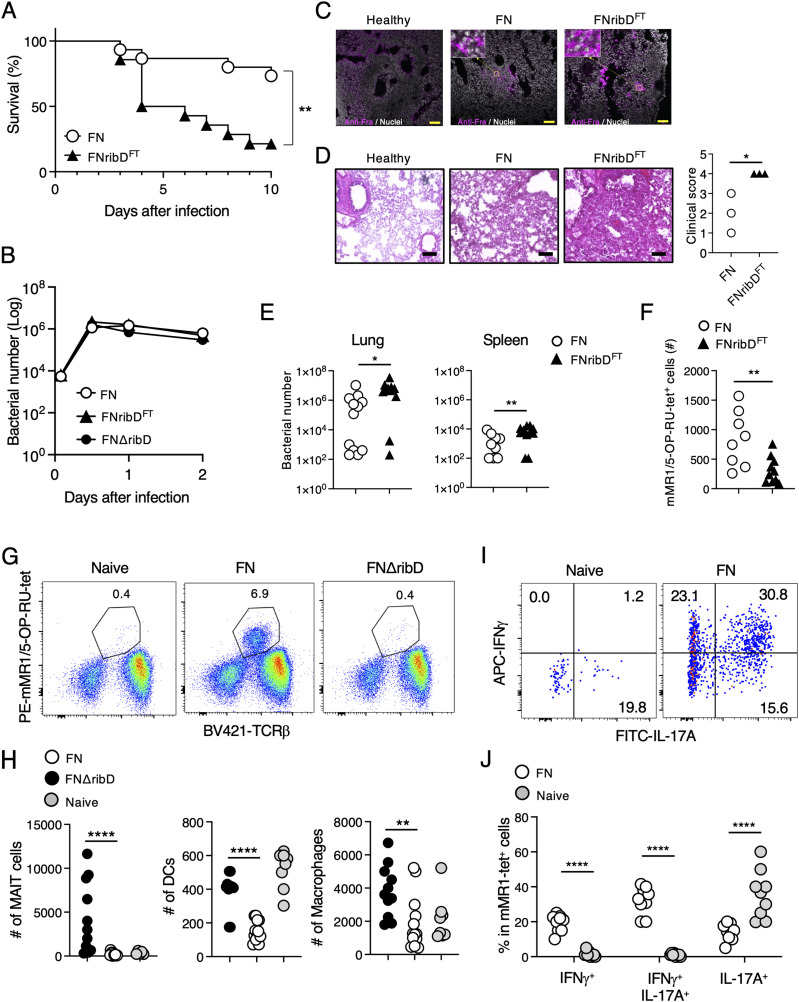
Figure 4. Amino acid substitutions in RibD increase the pathogenesis of F. tularensis.
(A) Survival rates of mice after intranasal infection with the FNribDFT or its parental strain FN (n = 15 in each group). Asterisks indicate statistical significance determined by logrank tests (**P < 0.01). (B) Graph shows the changes of bacterial numbers after infection in vitro. After infection with indicated strains to THP-1 cells, bacteria present in the cells were calculated at each time point. (C, D) Histological analysis of inflammation in the lung by immunohistochemistry (C) or H&E staining with quantified data (D) 4 d after intranasal infection. (C, D) Scale bar shows 10 μm (C) or 50 μm (D), respectively. Statistical significance was determined by unpaired two-tailed t tests (*P < 0.05). (E) Bacterial burdens in the indicated tissues 4 d after infection (n = 14 in each group). Statistical significance was determined by unpaired two-tailed t tests (*P < 0.05, **P < 0.01). (F) Numbers of mMR1/5-OP-RU-tet+ MAIT cells in the lung 4 d after infection. Statistical significance was determined by unpaired two-tailed t tests (**P < 0.01). (G, H) Flow cytometric analysis of lung 14 d after infection with the indicated strain. (G) mMR1/5-OP-RU-tet+ MAIT cells in the lung are shown after gating on total lymphocytes. (H) Plots show the absolute numbers of mMR1/5OP-RU-tet+ MAIT cells, mCD11c+ DCs, and mF4/80+ macrophages. Statistical significance was determined by one-way ANOVA, followed by Dunnett’s multiple comparison test (**P < 0.01, ****P < 0.0001). (I, J) Flow cytometric analysis of lung MAIT cells 9 d after infection with the avirulent strain FN. (I) After gating on mMR1/5OP-RU-tet+ cells, IFNγ and IL-17A production was analyzed by intracellular staining. (J) Graph shows frequencies of the indicated populations before and after infection with FN. Statistical significance was determined by unpaired two-tailed t test (****P < 0.0001). Data in (A, E, F, H, J) are combined from three independent experiments. Data in (B, C, D, G, I) are representative of three independent experiments.

