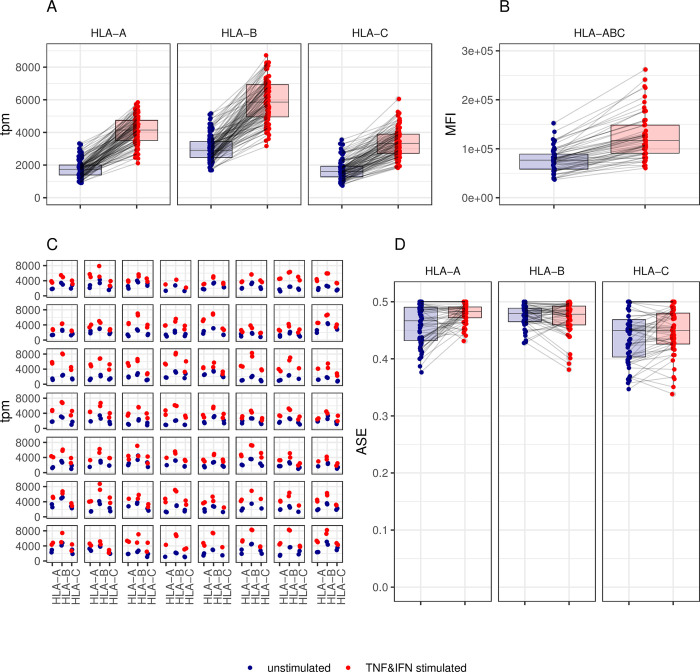
Fig 3. Upregulation of expression induced by TNFα and IFNβ.
Panel (A) RNA expression of HLA class I alleles (given as tpm) is plotted in 56 PBMC samples stimulated overnight with (red dots) or without (blue dots) pro-inflammatory cytokines TNFα and IFNβ Each dot represents one allele of one PBMC sample. Panel (B) Cell surface expression of HLA-ABC as determined by flow cytometry is plotted and expressed as MFI for the same PBMCs tested just prior to RNA extraction. Panel (C) Allelic expression is plotted per locus (horizontal axis) and per individual. Each facet represents one individual, each dot one allele. The dots are colored according to the same code as in Panel (A). Panel (D) Allele specific expression (ASE) at the three HLA class I genes is plotted according to both stimulation conditions.

