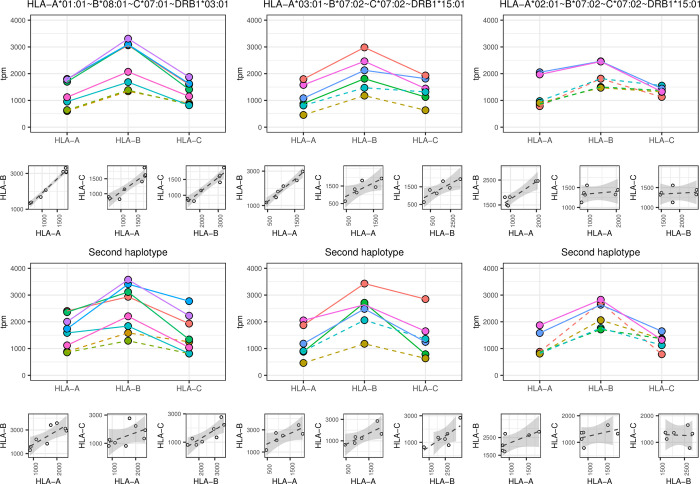
Fig 4. Allelic expression in PBMC carrying common HLA haplotypes.
The upper panels represent the RNA expression (in tpm) of alleles segregating on three common HLA haplotypes as indicated. In the lower panels, the RNA expression (in tpm) of the alleles belonging to the second haplotype is shown. Each individual carrying a given haplotype is shown with a different color code. Straight and dotted lines correspond to RNAs of cells kept in culture without stimulation overnight or of freshly isolated PBMCs, respectively. The HLA-typing of the second haplotype differ between samples sharing a common haplotype. Small facets represent the pairwise linear regression of expression between loci. The standard error of the regression is indicated as grey shedding.

