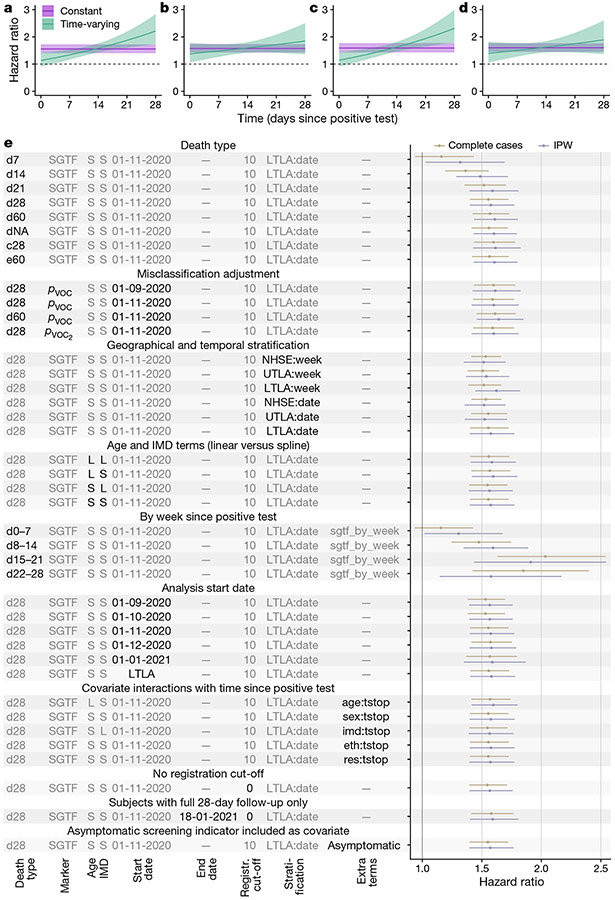
Fig. 2 ∣. Survival analyses.
a–d, Estimated hazard ratio of death (point estimate and 95% confidence intervals) within 28 days of a positive test for the SGTF analysis for complete cases (a), SGTF analysis with IPW (b), pVOC analysis for complete cases (c) and pVOC, analysis with IPW (d) in a model stratified by LTLA and specimen date and adjusted for the other covariates. e, Estimated hazard ratio of death (point estimates and 95% confidence intervals) across each model investigated. Death types are coded as follows: dX, all deaths within X days of a positive test; dNA, all deaths with no restriction on follow-up time; c28, death-certificate-confirmed deaths associated with COVID-19 within 28 days; e60, all deaths within 60 days plus all death-certificate-confirmed deaths associated with COVID-19 within any time period. S, spline term (for age or IMD); L, linear term (for age or IMD); NHSE, NHS England region (n = 7); UTLA, upper-tier local authority (n = 150); LTLA, lower-tier local authority (n = 316). LTLA start date signifies a start date chosen separately for each LTLA; Y:tstop signifies an interaction term between covariate Y and time since positive test (eth: ethnicity, res: residence type); pVOC2 signifies sequence-based misclassification adjustment (see Methods).

