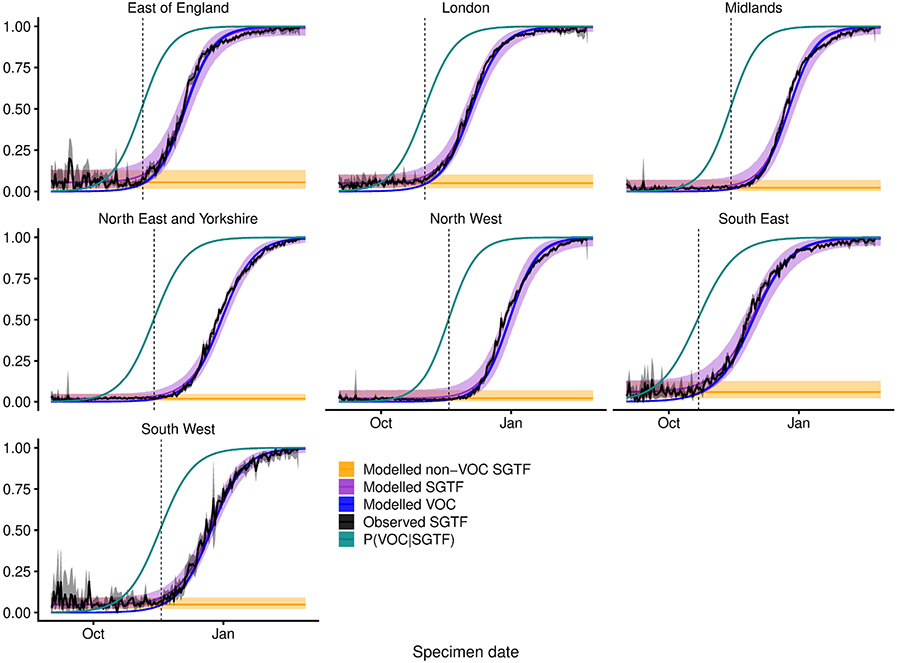
Extended Data Fig. 5 ∣. Misclassification model.
For each NHS England region, we fit a beta-binomial model (purple, modelled SGTF) to the observed SGTF frequencies among Pillar 2 tests (black, observed SGTF), which estimates a constant proportion of ‘false-positive’ SGTF samples among non-VOC 202012/01 (that is, non-B.1.1.7) specimens (orange, modelled non-VOC SGTF) and a logistically growing proportion of VOC 202012/01 (that is, B.1.1.7) specimens over time (blue, modelled VOC). This allows us to model the conditional probability that a specimen with SGTF represents VOC 202012/01 (teal, P(VOC∣SGTF)). For our misclassification survival analysis, pVOC = 0 for non-SGTF specimens and pVOC = P(VOC∣SGTF) for SGTF specimens. Lines show medians and shaded areas show 95% credible intervals. Dashed vertical lines show the date on which P(VOC∣SGTF) first exceeds 0.5.

