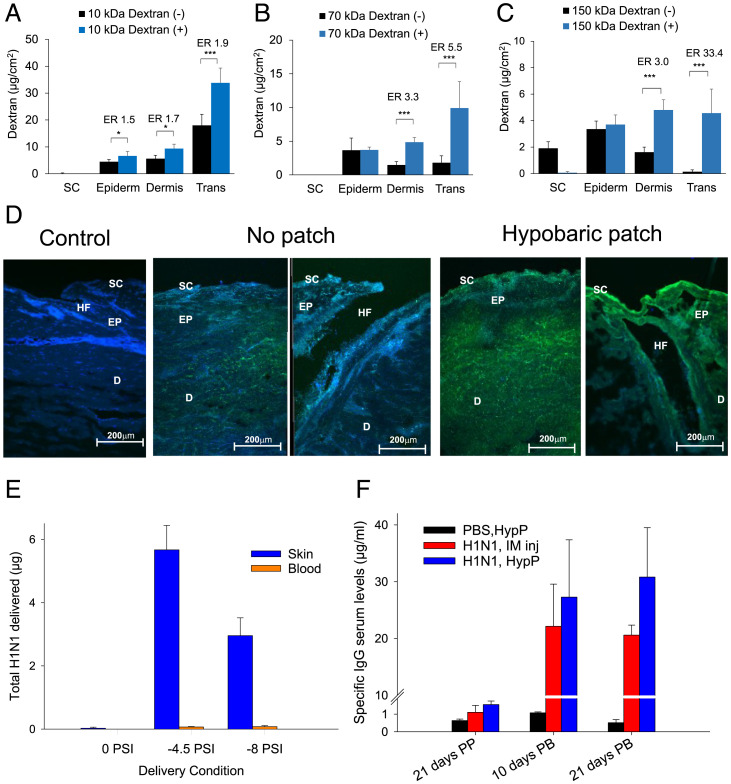
Fig. 4.
(A–C) The delivery of FTIC-dextran with (+) and without (−) the patch using a hypobaric pressure of 500 mbar: (A) 10 kDa FITC-dextran, (B) 70 kDa FITC-dextran, or (C) 150 kDa FITC-dextran. Skin deposition and permeation data represent mean ± SD (n = 5). ER was the ratio of dextran in the tissue with vs. without the hypobaric chamber patch. One-way ANOVA statistics applied (A–C) with *P < 0.05 and ***P < 0.001. (D) Confocal microscopy imaging (20× objective) of the skin (control) and the skin after the application of FITC-dextran (label is green) 10 kDa (Left) and 150 kDa (Right) with and without the hypobaric chamber patch. (E) The amount of H1N1 antigen delivered into the skin and blood noninvasively using the patch with two different application protocols data represents mean + 1 SD, n = 3 with *P < 0.05. (F) IgG response to the H1N1 antigen delivery into the skin using −4.5 psi for 20 min; data are mean + 1 SD, n = 3 with *P < 0.05.

