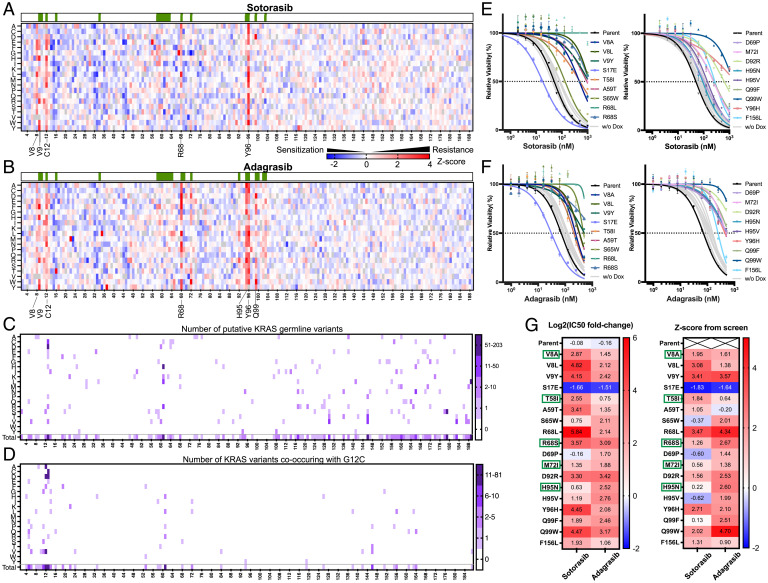
Fig. 2.
Screen results reveal cooccurring KRASG12C mutations resistant/sensitizing to G12C inhibitors. (A and B) Z-score analysis demonstrating the enrichment (red) and depletion (blue) of all single amino acid substitution mutants of KRASG12C during treatment using sotarasib (A) or adagrasib (B). The green bars above the heatmaps indicate the positions where the KRASG12C protein has direct contact with the inhibitor. (C) Combined number of all KRAS missense mutations that have been reported in noncancer records of the gnomAD and UK Biobank, along with predicted germline mutations from the FMI. The color key indicates the number of individuals combined from these three databases. (D) Number of all secondary mutations that co-occurred with KRASG12C identified in the FMI solid tumor database. The color key indicates the number of individuals. (E and F) Cell viability validation of the resistant/sensitizing phenotypes in H358 by generating 18 cell lines individually expressing KRAS (G12C + secondary mutation). Cells were treated with either sotarasib or adagrasib at indicated concentrations for 7 d after doxycycline induction. (G) Summary of IC50 shift (LFC before and after induction) and screen Z-score for sotarasib or adagrasib treatments in 18 mutant H358 cell lines as well as the parental line. Green boxes indicate mutations also identified in human genetic databases or FMI inquiries.

