Fig. 3.
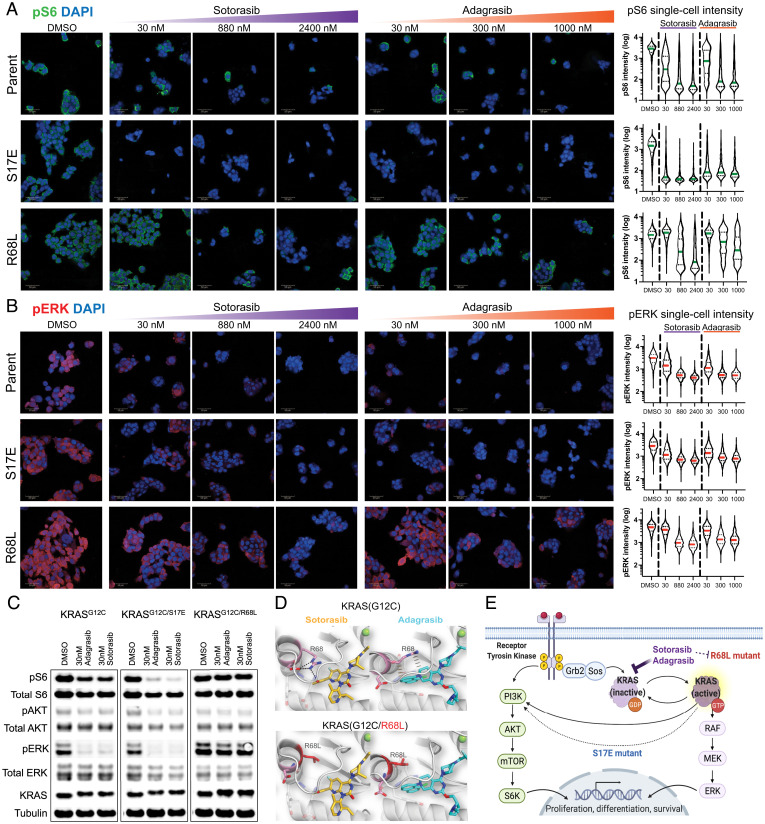
Cellular and structural characterization of selected cooccurring KRASG12C mutants. (A) pS6 immunofluorescence microscopy images and analysis of H358 KRASG12C and mutant KRASG12C/S17E or KRASG12C/R68L cell lines treated with sotarasib and adagrasib at indicated concentrations. Single-cell quantification of pS6 level demonstrates that KRASG12C/S17E line is more responsive in pS6 inhibition, while KRASG12C/R68L line is less sensitive (Scale bar, 50 μM). (B) pERK immunofluorescence microscopy images and analysis of H358 KRASG12C and mutant KRASG12C/S17E or KRASG12C/R68L cell lines treated with sotarasib and adagrasib at indicated concentrations. Single-cell quantification of pERK level demonstrates that KRASG12C/S17E line has a similar baseline level and drug response as the KRASG12C line, while KRASG12C/R68L line has a higher baseline level and less inhibition at suboptimal (30 nM) KRASG12C inhibitor treatment (Scale bar, 50 μM). (C) Western blot result of ERK, AKT, and S6 signaling in KRASG12C mutant cells. H358 KRASG12C, KRASG12C/S17E, or KRASG12C/R68L cell lines were treated with KRASG12C inhibitors at 30 nM for 24 h. (D) Modeled cocrystal structures of sotarasib and adagrasib bound to KRASG12C and KRASG12C/R68L, highlighting the interaction at residue R68 or R68L. (E) Schematic diagram of potential mechanisms of resistant (R68L) or sensitizing (S17E) mutants in the KRAS signaling pathway.

