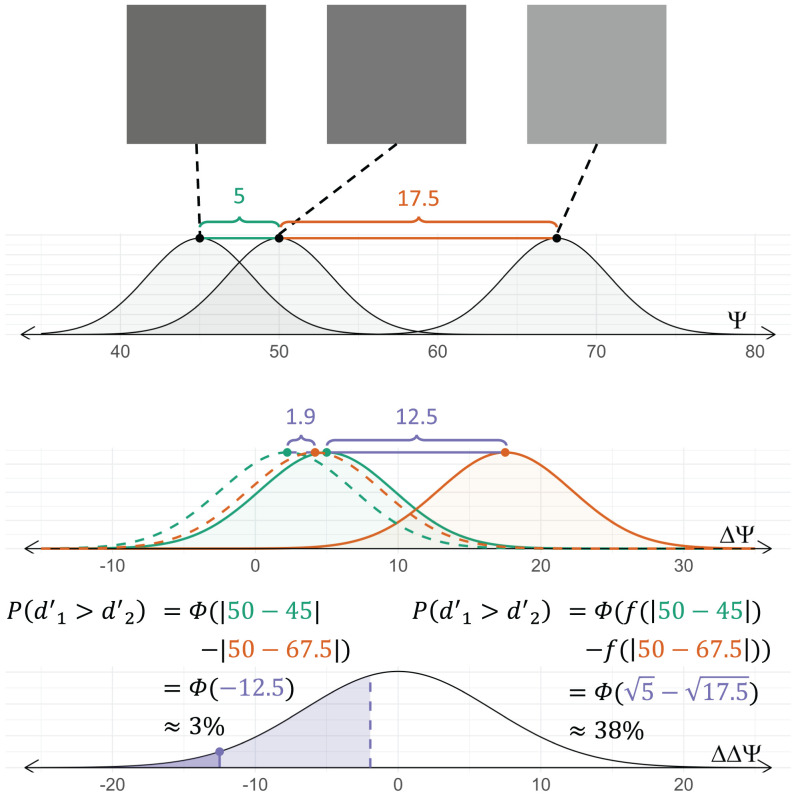
Fig. 3.
Thurstonian distance perception (58) of a triad modeled with (solid) and without (dashed) additivity with an example scaling function . If additivity is assumed and the gray-shaded Gaussians are appropriately centered, the difference between the means can be subtracted to give the perceived difference between the standard and either test (shown as the shaded green and orange triads). The difference between these means would be the perceived difference of differences, which can be plotted on a Gaussian centered at zero, as shown in Lower, to predict how often participants would be incorrect. However, if diminishing returns should exist, the means of the green and orange Gaussians should be scaled as demonstrated by the dashed distributions in the second row. The effect of the scaling function is an increased rate of predicted incorrect responses by more than an order of magnitude.

