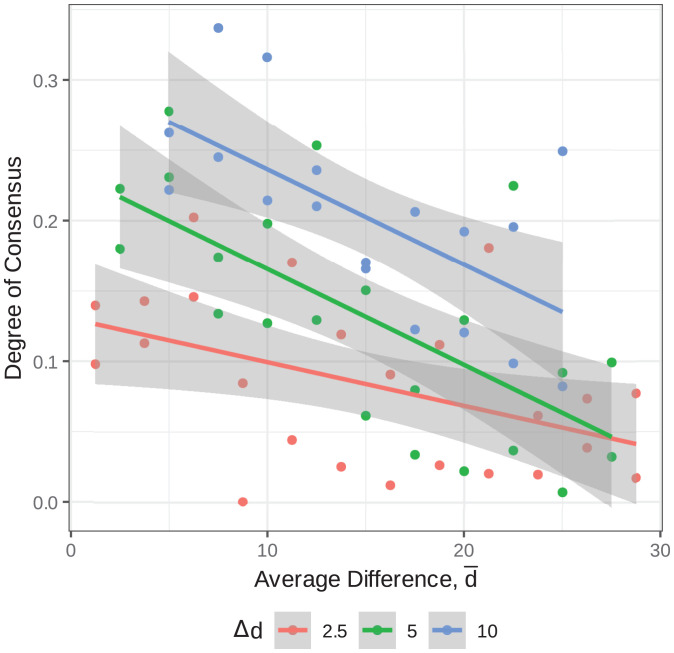
Fig. 5.
Degree of consensus is the absolute value of selecting a given test minus 50%. The negative slope of the lines indicates that participants’ responses tend toward chance with increasing average difference in the triad, despite the difference of differences remaining constant. A 95% CI around each line is shown in gray.

