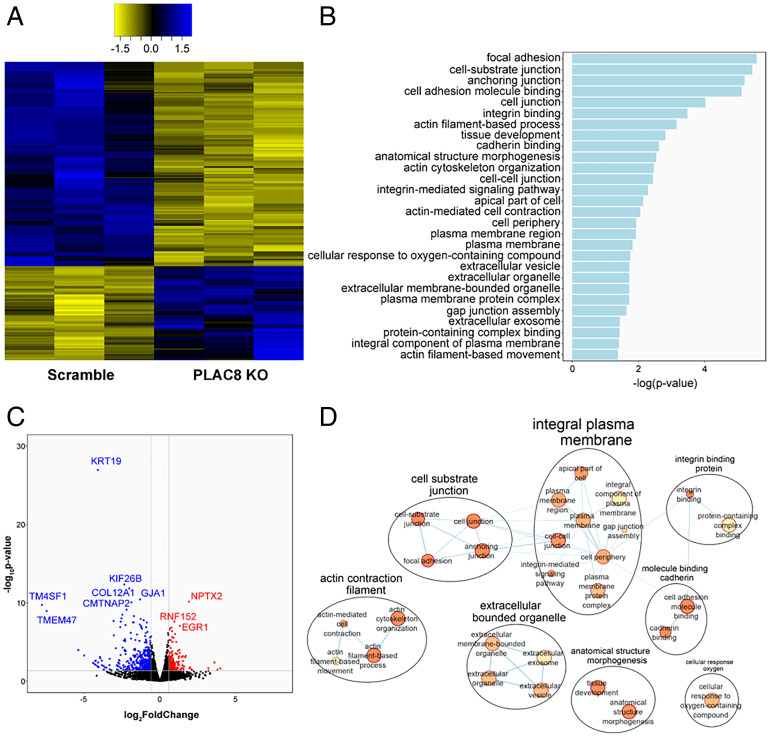
Fig. 2.
Transcriptomic analysis of PLAC8 KO Huh7.5 cells. (A) Heatmap of the normalized counts of significant DEGs between Huh7.5 Scramble and PLAC8 KO cells. Yellow indicates relatively lower expression, and blue indicates relatively higher expression. Data are shown from three replicate samples from each experimental condition. (B) Bar plot of the significantly enriched GO pathways between Huh7.5 Scramble and PLAC8 KO as determined by g:Profiler. (C) Volcano plot of DEGs between Scramble and PLAC8 KO Huh7.5 cells. Red denotes significantly up-regulated genes, and blue denotes significantly down-regulated genes. (D) Cytoscape EnrichmentMap of significantly enriched GO pathways as determined by g:Profiler.

