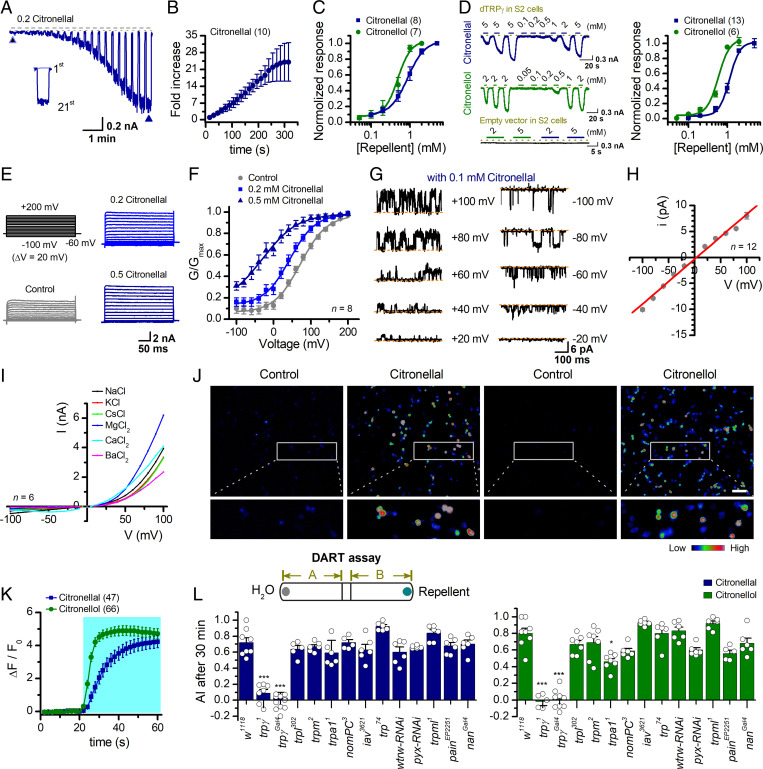
Fig. 4.
Drosophila TRPγ is necessary for the avoidance to natural repellents. (A) Representative whole-cell recordings of dTRPγ-expressing HEK 293T cells in response to repeated applications of 0.2 mM citronellal. A comparison between the responses to the first and the 21st applications is shown in Inset. The dotted line indicates zero current level. (B) Statistical plot of fold increase of peak response over repetitive stimulation. Data were normalized to the first pulse response (n = 10). (C) Dose-response curves of citronellal and citronellol for activation of dTRPγ channels. Solid lines indicate fits to the Hill equation, yielding EC50 = 0.87 ± 0.05 mM and nH = 2.0 ± 0.2 for citronellal (n = 8), EC50 = 0.49 ± 0.02 mM and nH = 2.5 ± 0.3 for citronellol (n = 7). (D) Representative traces of whole-cell recordings of Drosophila S2 cells transiently transfected with dTRPγ or empty vector in response to varying concentration of citronellol or citronellal after sensitization. (Right) Concentration-response curves of repellents for activation of dTRPγ channels. Solid lines indicate fits to the Hill equation with EC50 = 1.14 ± 0.07 mM, nH = 3.3 ± 0.6 for citronellal (n = 13); and EC50 = 0.59 ± 0.05 mM, nH = 3.0 ± 0.7 for citronellol (n = 6). (E) Representative whole-cell currents of dTRPγ-expressing HEK 293T cells elicited by a family of voltage pulses ranging from −100 mV to 200 mV with a 20-mV increment as indicated at upper left, in the presence of the bath solution (control), 0.2 mM citronellal, or 0.5 mM citronellal. Vh = -60 mV. (F) G-V relationships derived from the recordings shown in E. Solid lines correspond to fits with Boltzmann function, yielding V1/2 = 72.1 ± 2.6 mV for control; V1/2 = 43.3 ± 2.1 mV for 0.2 mM citronellal, and V1/2 = −29.7 ± 7.9 mV for 0.5 mM citronellal (n = 8). (G) Single-channel currents of dTRPγ recorded from outside-out membrane patches of HEK 293T cells evoked by 0.1 mM citronellal at the indicated holding potentials after sensitization induced by 2 mM citronellal. Dotted lines indicate the closed channel state. (H) Plot of unitary current amplitudes versus voltages. The unitary currents were determined by fitting all-point histograms with Gaussians. Unitary conductance assessed by fitting a linear function was 86.1 ± 0.5 pS (n = 12). (I) Current-voltage relations of dTRPγ in the presence of 0.5 mM citronellal, with bath solutions containing different cations as indicated. Pipette solutions contained 140 mM NaCl. Currents were elicited with 100-ms test pulses ranging from −100 mV to +100 mV with an increment of 10 mV (n = 6). (J) [Ca2+]i increases elicited by different agonists. Responses of dTRPγ-expressing HEK 293T cells to 2 mM citronellal or 2 mM citronellol measured by GCaMP6m fluorescence with 1.8 mM extracellular Ca2+. Color bar indicates the calibration of intracellular calcium concentration, [Ca2+]i. Activation of dTRPγ resulted in the rise of [Ca2+]i. (Scale bar, 100 μm.) (K) Time courses of the relative changes of GCaMP6m fluorescence. (L) Summary of avoidance responses of dTRP-KO strains to 2 mM citronellal or 2 mM citronellol, with the schematic representation of the DART assay shown above. Error bars represent SEM. In the citronellal panel, ***P = 1.11E−4 for trpγ1, 4.85E−5 for trpγGal4; in the citronellol panel, ***P = 1.63E−5 for trpγ1, 7.55E−6 for trpγGal4, *P = 0.027 for trpA11 versus WT control by ANOVA.

