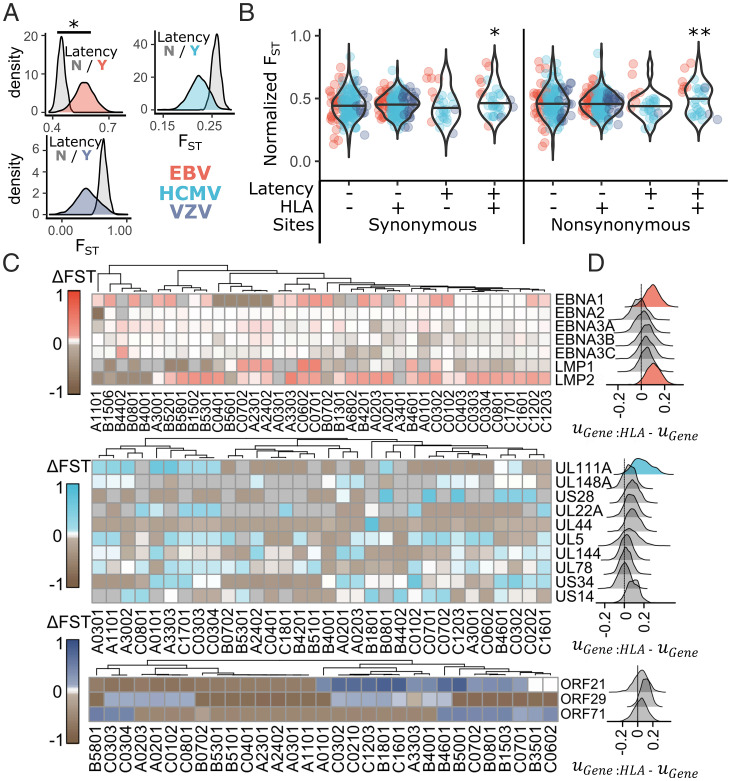
Fig. 3.
Herpesvirus latent peptides that bind HLA have increased population differentiation. Estimates of FST were compared between latent and nonlatent genes and between HLA binding and nonbinding sites in each herpesvirus protein using a linear mixed model to determine differences in FST. (A) The posterior distribution for FST in genes expressed during latency or not is plotted for each virus. (B) Normalized FST, where virus-specific effects on FST were removed from FST estimates for each herpesvirus gene (Materials and Methods), was plotted for HLA binding and nonbinding regions of latent or nonlatent herpesvirus genes using either synonymous or nonsynonymous polymorphism. Significance was assessed by the proportion of MCMC iterations that overlap zero for the posterior distribution of the interaction effect between HLA binding and latent expression ( in SI Appendix, Eq. 2). (C) The difference between FST in HLA binding vs. nonbinding regions of each herpesvirus gene (ΔFST) was calculated for every herpesvirus protein:HLA allotype combination. All EBV and VZV latency proteins included in the model and the 10 HCMV latency proteins with the highest ΔFST values are plotted, with box color corresponding to ΔFST. Allotypes were clustered based on similarity in ΔFST values across latent genes. (D) Plotted is the posterior distribution of the difference between and , which reflects the impact of HLA presentation on population structure of individual genes. Those with the 90% highest posterior density intervals that do not overlap zero are shaded with color. *P < 0.05; **P < 0.01.

