Fig. 4.
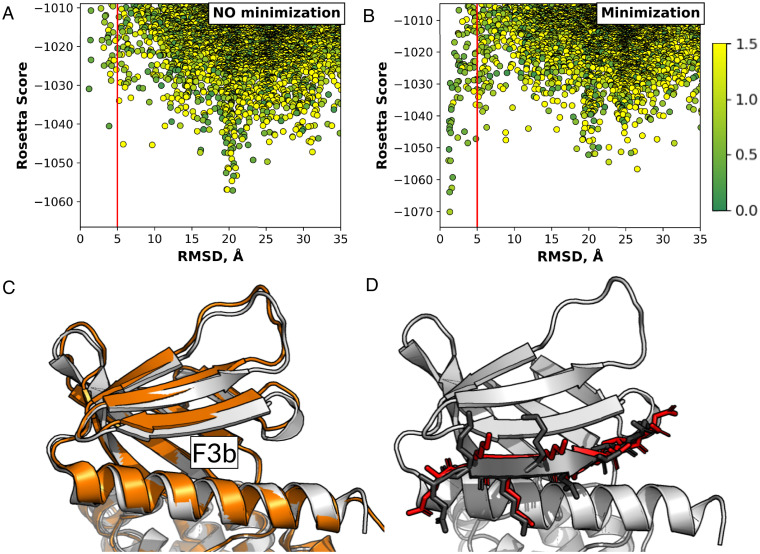
Successful modeling of a peptide into a closed binding pocket using PatchMAN, shown on the example of a CD44-derived peptide binding to the Moesin FERM domain F3b binding site. (A) PatchMAN simulation without receptor backbone minimization samples the correct binding pocket but misses it at the scoring stage. (B) PatchMAN simulation including receptor backbone minimization identifies a clear funnel around the native structure. (A and B) The red line indicates the 5 Å RMSD cutoff. The dots are colored according to a green-yellow scale that reflects source-target patch RMSD in ångstroms. (C) The moesin FERM domain structure, showing the unbound closed [gray, PDB ID code 1EF1 (25)] and the bound open F3b binding pocket [orange, PDB ID code 6TXS (26)] structures. A shift in the β-sheet at the F3b binding site is induced by peptide binding. (D) Comparison of model (red) to crystal structure (black) (for the crystal structure, only the peptide is shown).

