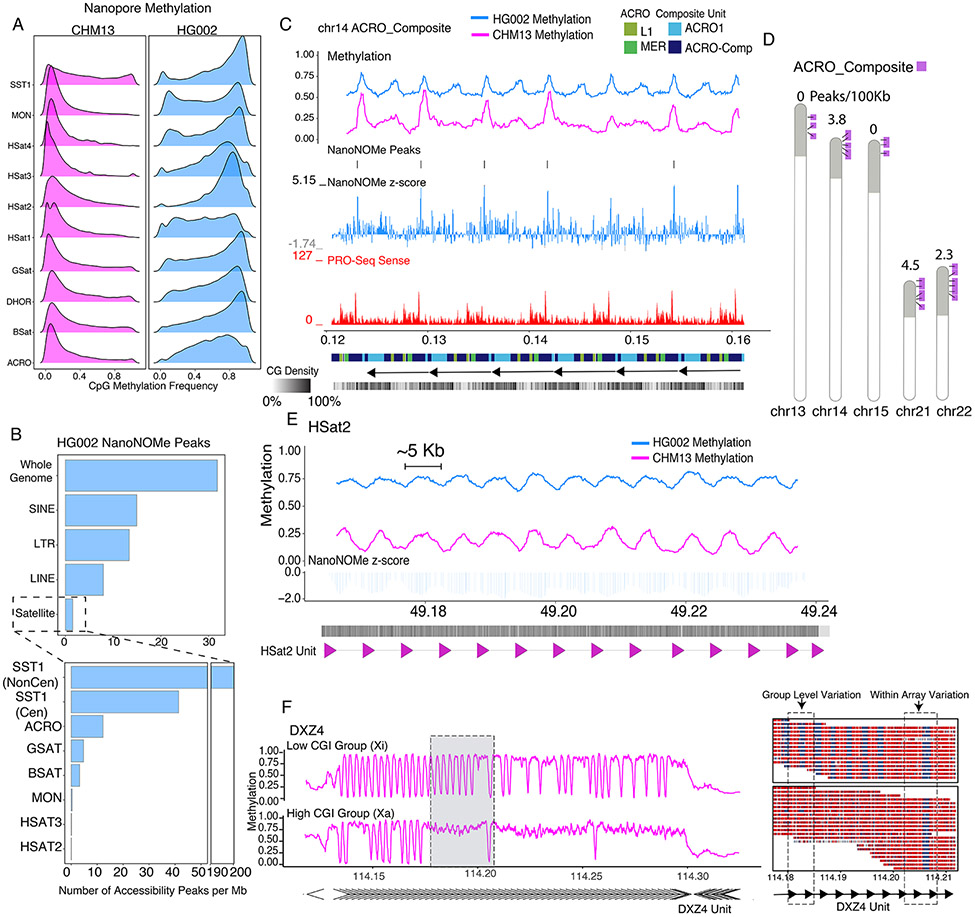
Figure 3. Context specific epigenetics in high identity tandem repeats.
A) Nanopore methylation frequency of satellite repeat classes in CHM13 and HG002. B) HG002 NanoNOMe statistically significant peak calls(18) per 1Mb of sequence in all major repeat classes compared to the whole genome (Top) and within different satellite repeats (Bottom). C) Nanopore CpG Methylation profiles, HG002 NanoNOMe accessibility peaks and Z-score (negative is inaccessible, positive is accessible), and non-kmer filtered (multimapping) PRO-Seq coverage at the ACRO_Composite repeat (chr14:121,193-162,142). Annotation tracks below are the RepeatMasker V2 annotation from (44), monomeric annotations of the ACRO_Composites and a GC density track. D) Ideogram showing the arrayed locations of the ACRO_Composite across the acrocentric chromosomes (purple) within the acrocentric short arms (gray shaded). Listed above each chromosome is the nanoNOMe ACRO_composite peak density in peaks/100kb. E) Nanopore CpG Methylation profiles and HG002 NanoNOMe accessibility Z-score of the HSat2 repeat (chr16:49,163,529-49,239,753). Annotation bars below represent CpG density and HSat2 repeat units on the bottom. F) The DXZ4 locus on CHM13 clustered into two haplotypes (low CGI methylation and high CGI methylation), based solely on promoter methylation state. (Left) Methylation frequency plot of each haplotype. (Right) Single reads from the gray highlighted region on the left with boxes highlighting CGI cluster group level epigenetic variability and intra-array level epigenetic variable between neighboring monomeric units.

