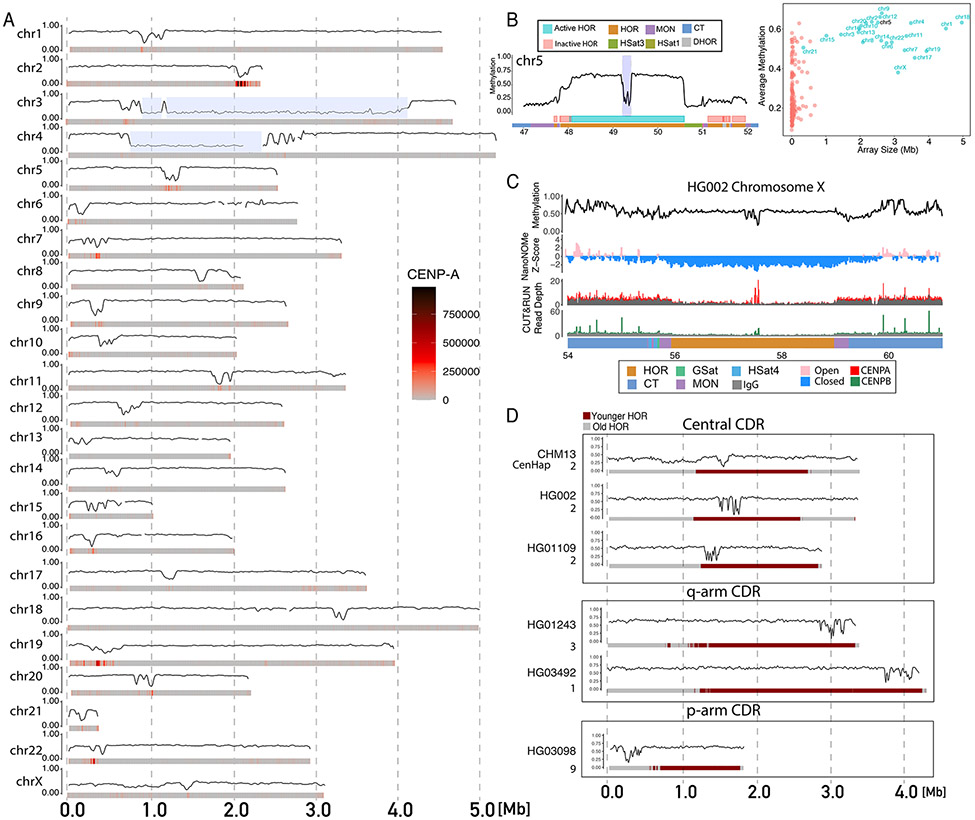
Figure 4: Epigenetic maps within human centromeres.
A) Smoothed methylation frequency in 10kb bins of the active HOR array for all CHM13 chromosomes. CENP-A enrichment from CUT&RUN data shown as a heatmap under each plot. Chromosomes 3 and 4 have a HSat1 repeat (blue highlight) that breaks up the live HOR array. B) (Left) CHM13 methylation in the centromeric region of chromosome 5. Smoothed methylation frequency is plotted in 10 kb bins. HOR arrays are annotated as blue (“active”) and pink (“inactive”). (Right) Scatter plot of average methylation within each HOR array versus size in Mbp. C) Methylation, nanoNOMe accessibility, CENP-A and CENP-B CUT&RUN data across the chromosome X centromeric array on HG002. Smoothed methylation and accessibility are plotted in 15kb bins, CUT&RUN is plotted as raw read counts with input shaded gray. Bottom bar annotates satellite regions indicating the location of the HOR, MON, GSat, HSat4 and CT regions. D) Methylation in the active HOR array across diverse individuals. Coriell cell line sample ID and cenhap group annotated to left. HORs are annotated as red (younger) and gray (older) computed on the basis of sequence divergence.

