
Figure 2.
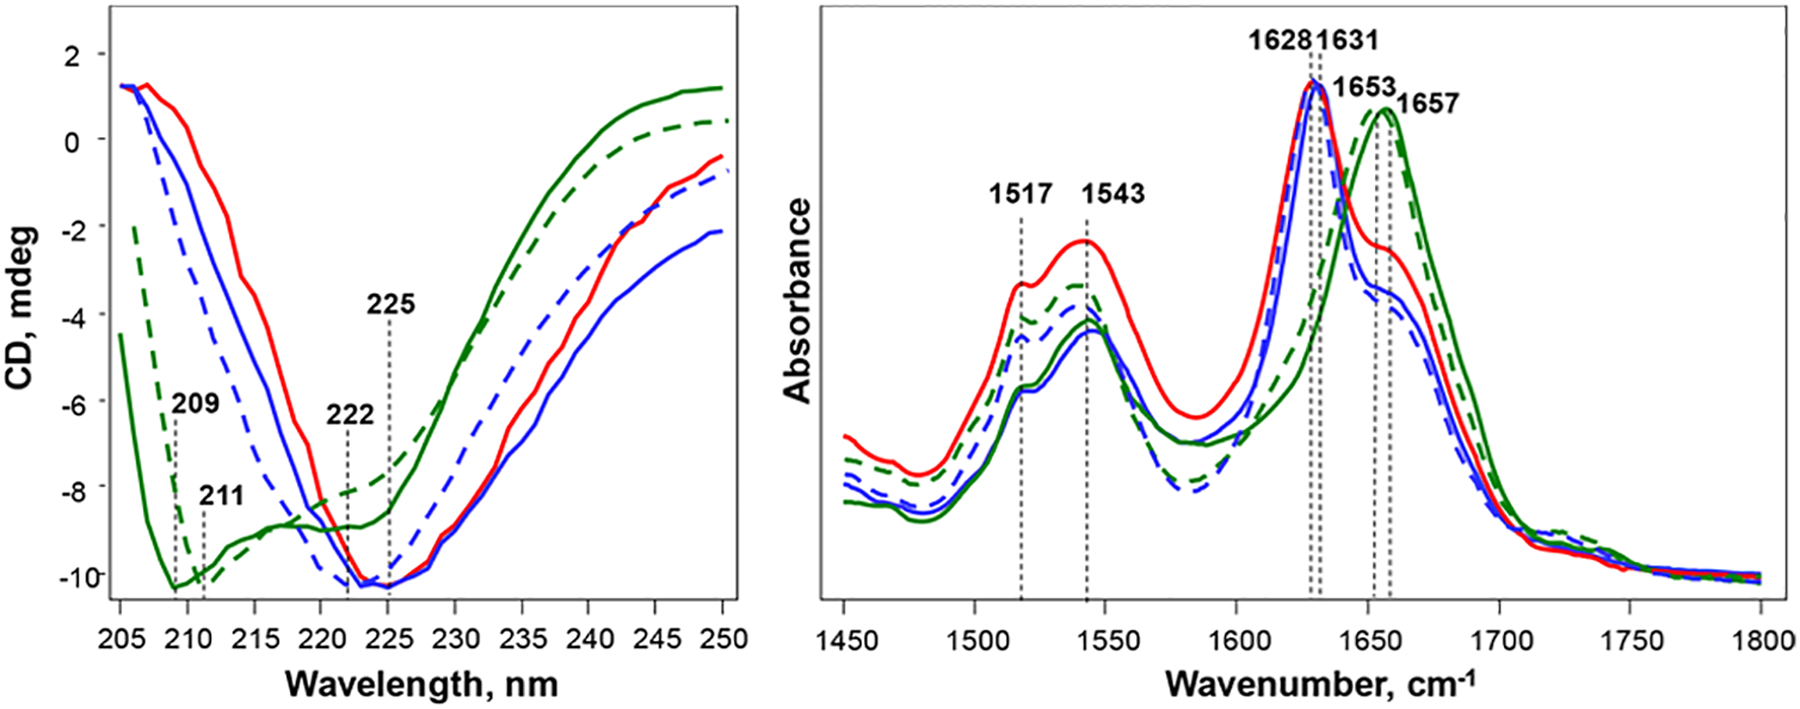
Structural analysis of insulin aggregates. (Left) CD and (right) ATR-FTIR spectra of insulin aggregates (Ins) grown in the lipid-free environment (red) as well as in the presence of Ins:CL-s (solid blue), Ins:CL-u (dashed blue), Ins:PC-s (solid green), and Ins:PC-u (dashed green).