. 2022 May 25;11:e78110. doi: 10.7554/eLife.78110

Figure 3. Anatomy of different gustatory receptor neuron (GRN) groups overlays with GRNs of different taste categories.

NBLAST comparisons yielded best matches of electron microscopy (EM) groups and GRNs of different taste classes. (A–F) Overlain are EM groups 1–6 (magenta) and best NBLAST match of GRN class (immunohistochemistry, green), frontal view (left), and sagittal view (right), scale bar = 50 µM.

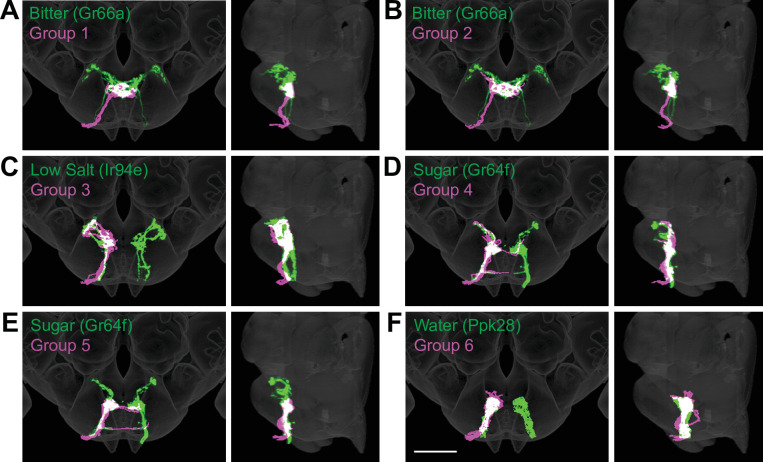
Figure 3.

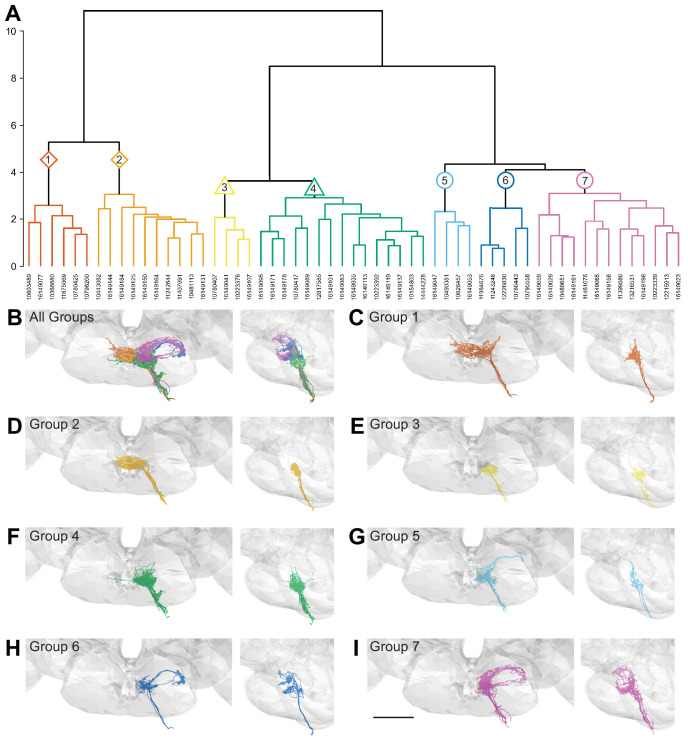
Figure 3—figure supplement 1. Morphology- and connectivity-based clustering generates distinct groups of gustatory receptor neurons (GRNs).

Figure 3—figure supplement 1.

(A) Tree denoting relative similarity of GRNs based on morphology and connectivity of GRNs in the left hemisphere. (B) Frontal and sagittal views of all GRN groups, colored according to (A). (C–I) Frontal and sagittal views of group 1–7 GRNs, scale bar = 50 µM.
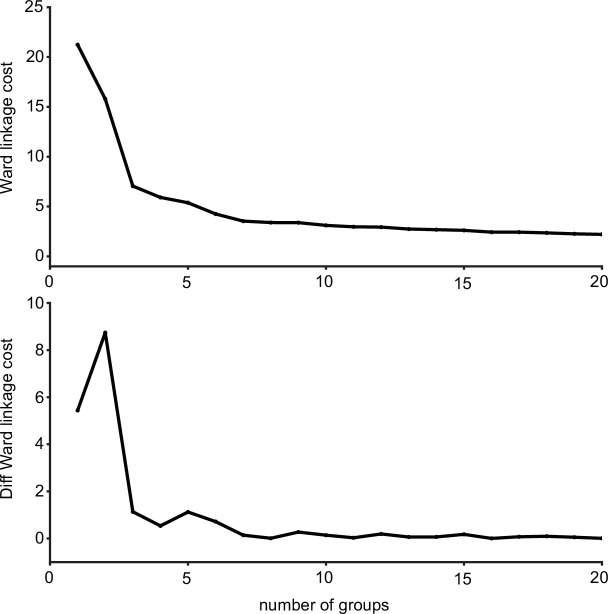
Figure 3—figure supplement 2. Ward’s joining cost and the differential of Ward’s joining cost for hierarchical clustering of gustatory receptor neurons (GRNs) in the left hemisphere.

Figure 3—figure supplement 2.

(Top) Ward’s joining cost for clustering into groups. Ward’s joining cost declines sharply when clustering with seven groups compared to clustering with fewer than seven groups. (Bottom) Differential of Ward’s joining cost for clustering into groups. The differential is high when clustering into six groups or fewer but does not decline notably after seven groups are reached.