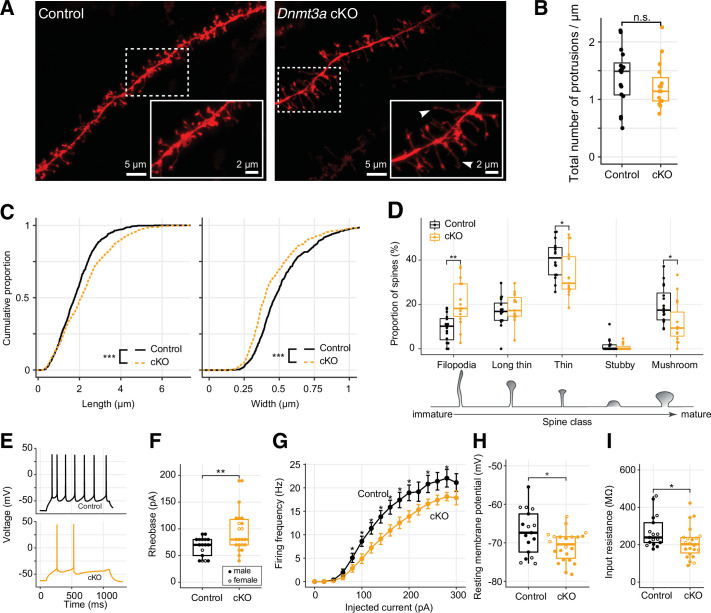
Figure 2. Immature spine morphology and reduced excitability of layer 2 excitatory neurons following Dnmt3a conditional knockout (cKO).
(A) Example dendritic segments of layer 2 pyramidal neurons in the prelimbic region labeled with DiI and visualized using a 63× objective coupled to an Airyscan confocal microscope. Arrowheads show filopodia, which were more abundant in Dnmt3a cKO mice. (B) The density of membrane protrusions was unchanged in the Dnmt3a cKO (Wilcoxon test, n.s., not significant). (C) Membrane protrusions were significantly longer and narrower in the Dnmt3a cKO (KS test, p<0.001). (D) More spines were classified as immature filopodia, and fewer as mature mushroom-shaped spines with large postsynaptic densities in the Dnmt3a cKO (Wilcoxon test, **, p=0.0015; *, p=0.046 and 0.011 for thin and mushroom, respectively). (E) Example whole-cell patch-clamp recordings from prelimbic layer 2 pyramidal neurons following 60 pA current injections. (F) The median rheobase (i.e. the minimal current necessary to elicit an action potential) was significantly higher in the Dnmt3a cKO (t-test, **, p=0.0042). (G) Action potential frequency vs. injected current (mean ± SEM) showed reduced excitability in Dnmt3a cKO (Wilcoxon test, *, p<0.05). (H) and (I) Dnmt3a cKO neurons were slightly hyperpolarized at Vrest when compared to control (Wilcoxon test, *, p=0.049) and had lower membrane resistance (Wilcoxon test, *, p=0.023).
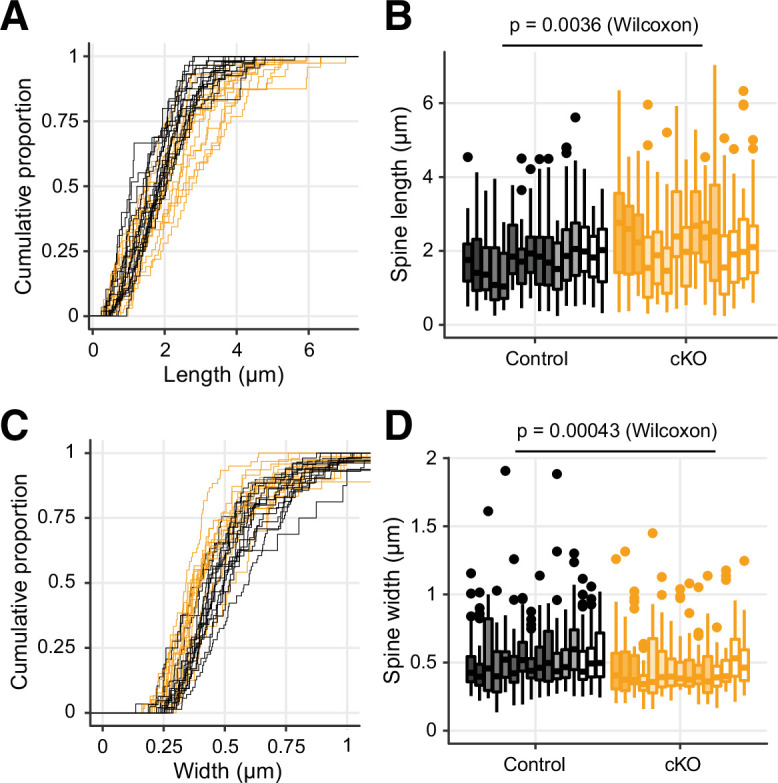
Figure 2—figure supplement 1. The membrane protrusions in the Dnmt3a conditional knockout (cKO) showed longer dendritic spines and narrower heads.


