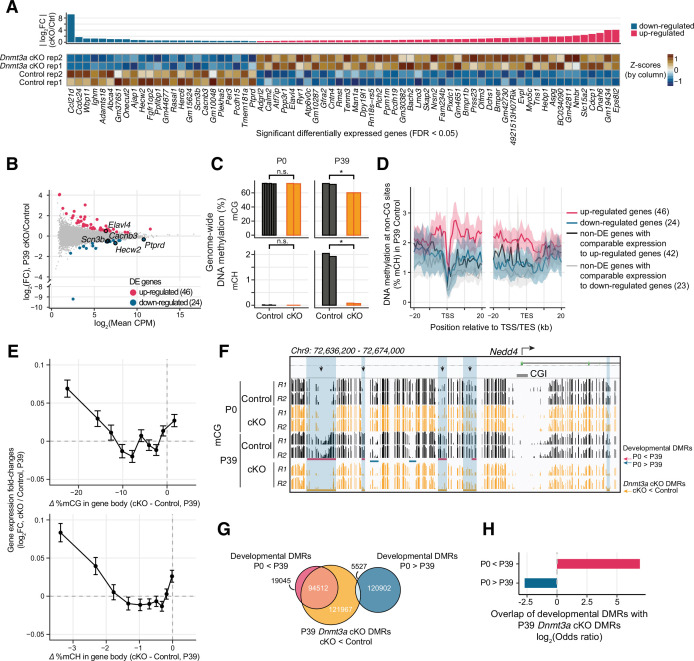
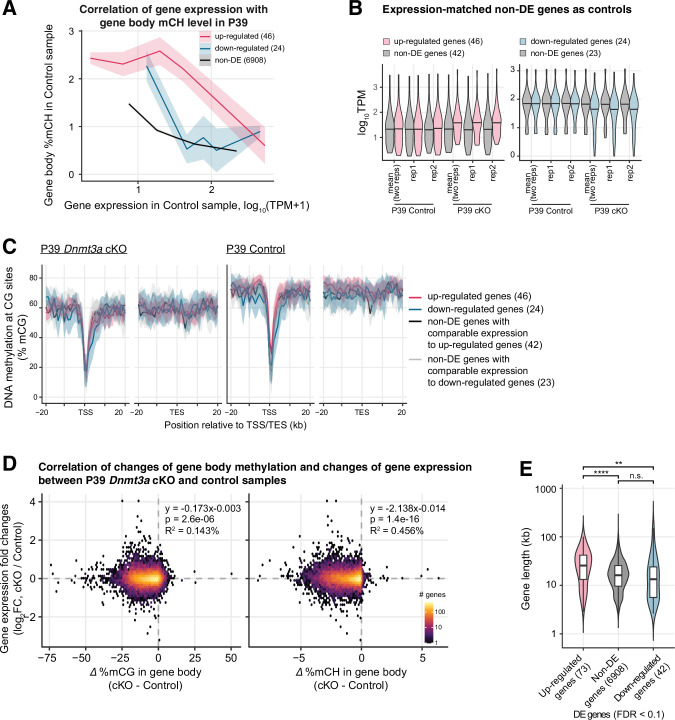
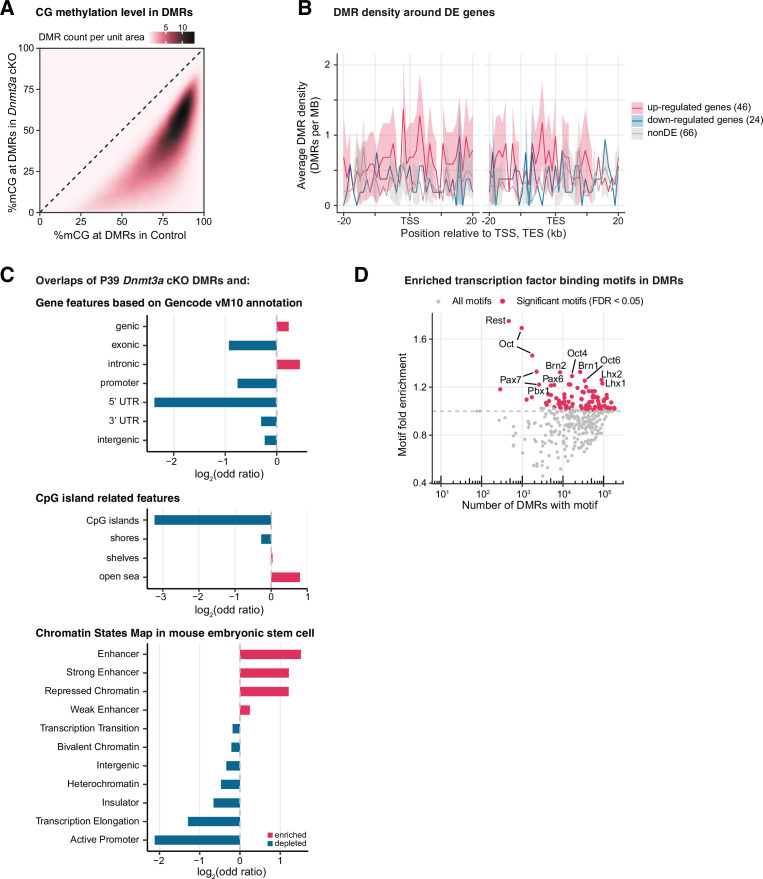
Figure 3. Loss of Dnmt3a leaves thousands of genomic regions in a fetal-like demethylated state.
(A) 70 genes were differentially expressed (DE) (false discovery rate [FDR] < 0.05) in P39 pyramidal neurons in Dnmt3a conditional knockout (cKO) vs. control. Top, fold-change (FC) between cKO and control; bottom, heatmap showing normalized expression of the DE genes in each sample. Z-scores were computed using mRNA counts per million (CPM) for each DE gene. (B) Differential gene expression in control vs. Dnmt3a cKO excitatory neurons at P39. Significant up-regulated and down-regulated DE genes are shown in red and blue, respectively. Differentially expressed (DE) genes associated with dendrite morphogenesis (Elavl4, Hecw2, Ptprd), and regulation of Na+ (Hecw2, Scn3b) and Ca2+ levels (Cacnb3) are labeled. (C) Non-CG DNA methylation (mCH) is eliminated, and mCG is reduced, in P39 Dnmt3a cKO pyramidal cells, while mCG and mCH levels are not changed in P0 (t-test: *, p<0.05; n.s., not significant). P0 and P39, postnatal days 0 and 39, respectively. Each bar represents the methylation level in one replicate. (D) Non-CG DNA methylation (mCH) in P39 pyramidal cells in control samples, in 1 kb bins in the flanking region around the transcription start (TSS) and end site (TES) of DE genes and non-DE genes with matched expression levels. The lines denote the means across genes in each gene set, and the shared areas represent the 95% confidence intervals of the means. (E) The difference in gene body methylation vs. fold-change of gene expression between P39 Dnmt3a cKO and control. The plots show mean ± SEM gene expression fold-change for genes in 10 non-overlapping bins (deciles of mC difference). (F) The Nedd4 promoter locus contains five differentially methylated regions (DMRs, yellow horizontal rectangles and shaded in blue boxes) with naive, fetal-like mCG in P39 Dnmt3a cKO. Ticks show mCG at CG sites. Four out of the five P39 Dnmt3a cKO DMRs overlapping developmental gain-of-methylation DMRs (red horizontal rectangles) are marked with arrows. CGI, CpG island. R1 and R2, replicates 1 and 2. (G) Overlap of P39 Dnmt3a cKO DMRs and developmental DMRs. (H) P39 Dnmt3a cKO hypo-DMRs are significantly enriched (depleted) in DMRs that normally gain (lose) methylation during development (Fisher’s test, p<0.05).

