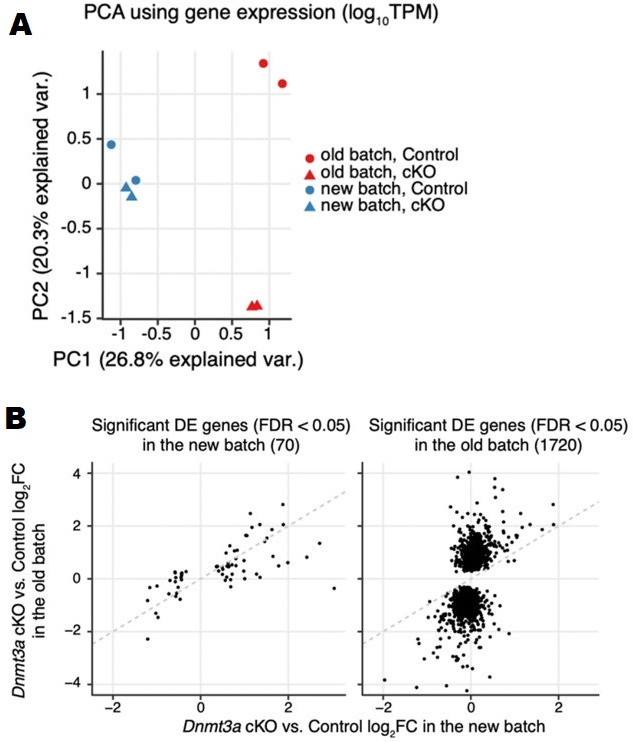
Author response image 2. (A) PCA plot using log10TPM gene expression in the two batches of RNA-seq samples. (B) Scatter to show the consistency of gene expression fold-changes (Dnmt3a cKO vs. control) across the two batches of RNA-seq samples using significant DE genes detected in the new batch (left) and significant DE genes detected in the old batch (right).

