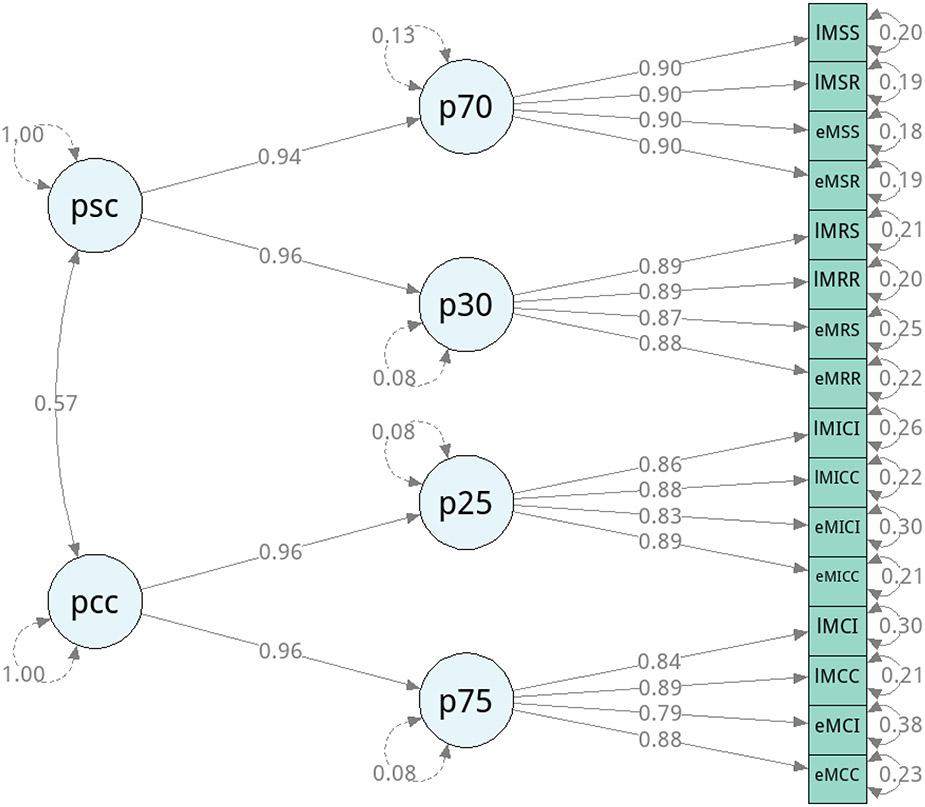
Figure 2. Control-Learning Structural Equation Model.
Mean Reaction Times (ms) within condition-specific variables for unbiased (PC-50/PS-50) items are modeled to reflect their respective context-specific proportion latent variables, which then reflect correlated domain-specificity. The path diagram above was produced with the semPlot package and displays the standardized estimates after model estimation. E = Early, L = Late within context. MC = Mostly Congruent (PC-75), MI = Mostly Incongruent (PC-25), MR = Mostly Repeat (PS-30), MS = Mostly Switch (PS-70) contexts. C = Congruent, I = Incongruent, R = Repeat, S = Switch trial. P70 = PS-70, P30 = PS-30, P25 = PC-25, P75 = PC-75, PSC = Proportion Switch Contexts, PCC = Proportion Congruent Contexts.

