. 2022 May 23;11:e74410. doi: 10.7554/eLife.74410

Figure 2. Consequences of deleting Dcp2 leucine-rich Pat1-binding motifs.

(A) Two-hybrid assays evaluating the consequences of deleting the leucine-rich motifs (L1–L9) from the Dcp2 C-terminal domain. As in Figure 1B, schematics of the individual dcp2 alleles are shown on the left (with specific element deletions denoted by triangles) and duplicate two-hybrid assays are on the right. (B) Northern analyses of individual Pat1/Lsm1 and Pat1/Lsm1/Dhh1 substrate levels in cells harboring individual or combined deletions of Dcp2 leucine-rich motifs. (C) Bar graphs of average ± SEM for a subset of the northern analyses depicted in B. The relative levels of each decapping substrate in different strains were determined from three independent experiments, with one representative blot for each transcript shown in panel B. See also Figure 2—figure supplement 1.

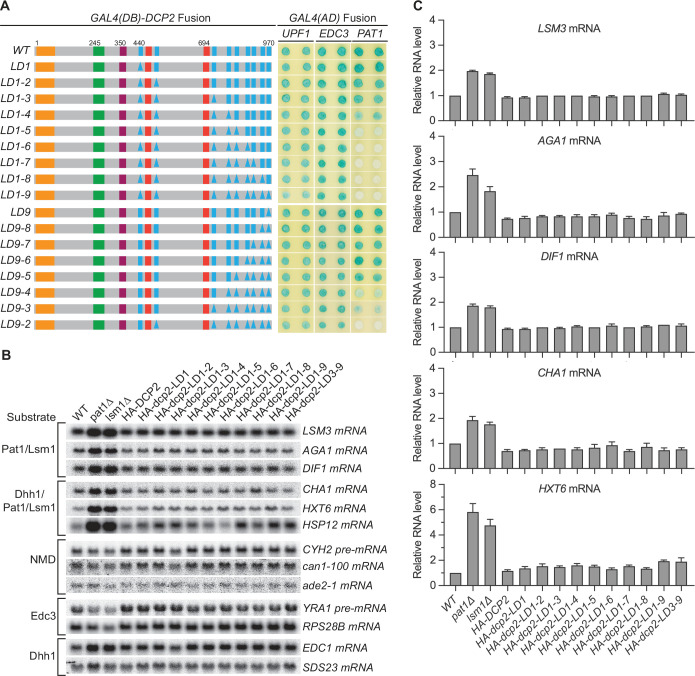
Figure 2.

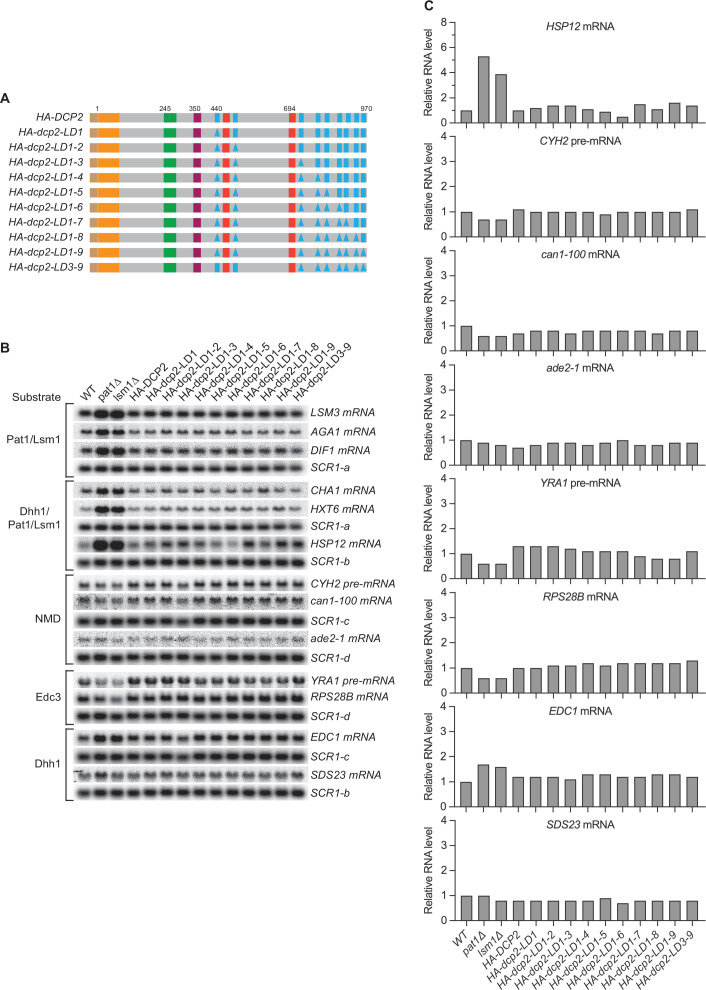
Figure 2—figure supplement 1. Loss of single, multiple, or even all nine leucine-rich motifs has no effect on decay of Pat1/Lsm1 and Pat1/Lsm1/Dhh1 substrates.

Figure 2—figure supplement 1.

(A) Schematics of dcp2 alleles harboring specific deletions of the leucine-rich Pat1-binding motifs. Each dcp2 allele contains a triple HA-tag at its N-terminus and was integrated at the DCP2 genomic locus for phenotypic analysis of mRNA decay. Specific element deletions are marked by filled triangles. (B) Northern analyses of individual Pat1/Lsm1 and Pat1/Lsm1/Dhh1 substrate levels in cells harboring individual or combined deletions of Dcp2 leucine-rich motifs. The northern blots shown here are the same as those in Figure 2B but contain matched loading control SCR1 blots. In all blots, lower case letters denote SCR1 blots duplicated for clarity of presentation. (C) Bar graphs for a subset of the northern analyses depicted in Figure 2B. In each case, the relative RNA levels in different mutants were determined by comparison to the levels of the same transcripts in wild-type cells. The graphs depict data from single measurements. Eight graphs (HSP12, can1-100, ade2-1, RPS28B, EDC1, and SDS23 mRNAs, and CYH2 and YRA1 pre-mRNAs) in this figure did not have error bars. However, the phenotypic analyses for six out eight of these substrates in relevant dcp2 element mutants were independently repeated in our subsequent experiments (Figure 4B).
Figure 2—figure supplement 1—source data 1. Northern analyses of different decapping substrate levels in cells harboring individual or combined deletions of Dcp2 leucine-rich motifs.