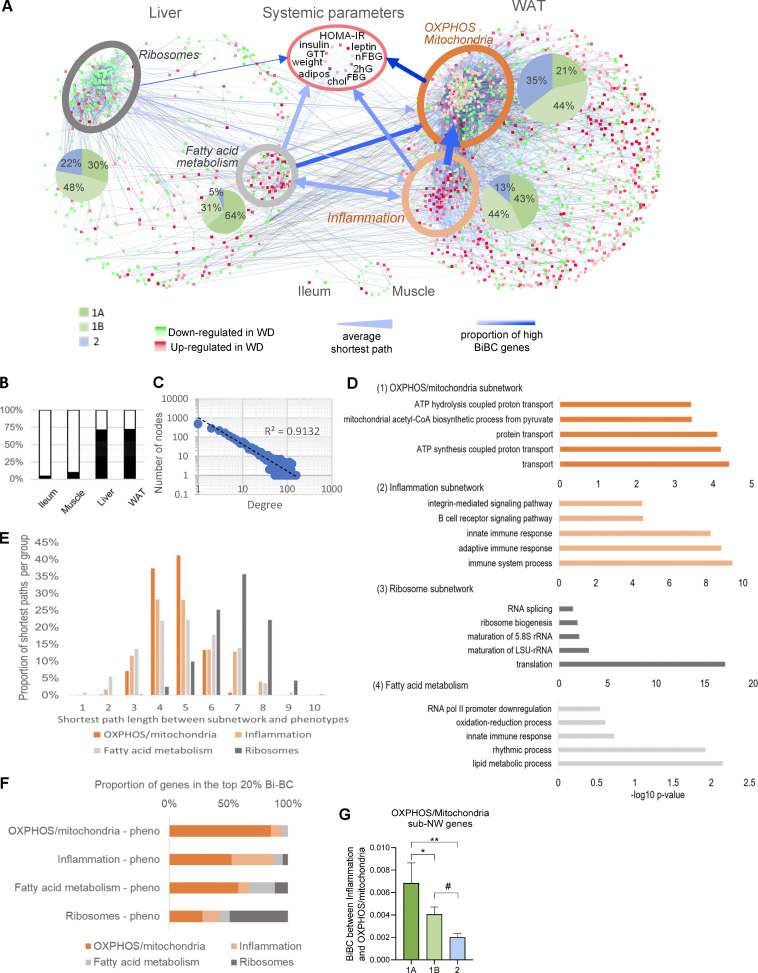
Figure 2.
Multiorgan network analysis identifies OXPHOS/mitochondria in WAT as a key driver of systemic metabolism. (A) Multiorgan co-variation network demonstrating connections between DEGs in liver (565 nodes), WAT (1,747 nodes), ileum (3 nodes), and muscle (16 nodes) and host systemic metabolic parameters. Subnetworks identified within WAT and liver are highlighted by ellipses. The shades of red and green colors of nodes indicate increased and decreased expression in HFHS-fed SPF mice, respectively, with color intensity indicating the level of HFHS vs. ND fold change in SPF mice. The blue and black colored edges (lines) indicate positive and negative correlations, respectively, and the color intensity of edges indicates the strength of correlation. Width of blue arrows reflect the average shortest path distance between each subnetwork; arrow color intensity represents the proportion of top-ranked genes (based on BiBC) in each of the subnetworks. The arrowheads indicate the flow of information between sub-networks showing that the inflammation subnetwork is strongly connected to the OXPHOS/mitochondria subnetwork (wide arrow), and it relies on the OXPHOS/mitochondria subnetwork to regulate the metabolic parameters (darker blue). (B) The bar plot shows percent of DEGs in each organ that were retained in the network (black) after filtering out nodes that did not fulfill statistical and causality criteria (white). (C) Power-law distribution of the number of nodes and edges in the multiorgan network. (D) Gene ontology enrichment analysis of the four subnetworks: (1) WAT OXPHOS/mitochondria, (2) WAT inflammation, (3) liver ribosomes, and (4) liver fatty acid metabolism subnetworks. The top five most significant biological processes and cellular component terms are shown along with adjusted P values. (E) Shortest path analysis. Distribution of pairwise shortest path lengths between the nodes of each subnetwork and systemic metabolic parameters (systemic phenotypes). The average shortest path is a metric evaluating closeness of one section of a network to another. The shortest paths were estimated between all four subnetworks and systemic metabolic parameters, weighting the shortest paths to account for the fact that closer nodes potentially have a bigger impact. The systemic metabolic parameters were nearly equidistant to all subnetworks except for the distant ribosomal subnetwork. The fatty acid metabolism and OXPHOS/mitochondria pathways were closest to systemic metabolic parameters overall. The y axis represents the proportion of genes, normalized per subnetwork, that are the indicated shortest path length away from systemic metabolic parameters (x axis). All comparisons between shortest path distributions of subnetworks were conducted using a chi-square test, and all were significant with a P value <0.0001. (F) BiBC as a proxy between pathway interaction. To determine the likelihood of each of these subnetworks to be the hubs of the information flow (i.e., bottlenecks) between each of the other subnetworks and systemic metabolic parameters, BiBC of each subnetwork was calculated. The proportion of genes from each subnetwork in the top 20% BiBC between that subnetwork and systemic metabolic parameters is shown. Larger proportions indicate a greater importance of the subnetwork in regulating metabolic parameters. All comparisons between subnetworks were conducted using a chi-square test, and all were significant with a P value <0.0001. This means the OXPHOS/mitochondria and ribosomal subnetworks rely little on the other identified subnetworks to reach systemic metabolic parameters. On the contrary, half of the effects of the inflammation and fatty acid metabolism subnetworks on systemic metabolic parameters are directed through the OXPHOS/mitochondria subnetwork in adipose tissue, suggesting the importance of the OXPHOS/mitochondria pathway in regulating glucose metabolism. Accordingly, the integration of the results of shortest paths and BiBC analyses showed that the OXPHOS/mitochondria pathway in adipose tissue partially mediates the effects of both fatty acid metabolism in liver and inflammation in adipose tissue on systemic metabolism. (G) Microbiota-dependent genes show higher BiBC between inflammation and OXPHOS/mitochondria than microbiota-independent genes. Comparison of BiBC values between three categories (Fig. 1 C) for genes in OXPHOS/mitochondria subnetwork. Since microbiota-driven inflammation is one of the two main pathways influencing OXPHOS/mitochondria, we compared potential regulatory capacity (using BiBC as a proxy) of interactive (cat. 1A), additive (cat. 1B), and microbiota-independent (cat. 2) components of this pathway. For this, we calculated the BiBC of each gene between the inflammation and OXPHOS/mitochondria subnetworks (Fig. 2 F). Then, we compared BiBC values of the OXPHOS/mitochondria subnetwork genes between three gene categories defining microbial contribution to their regulation (microbiota-dependent with interaction [1A], microbiota-dependent no interaction [1B], and microbiota-independent [2]). Significantly higher values of BiBC were found for category 1A genes than for 1B and 2 (mean ± SEM, P values based off ANOVA, followed by Tukey’s multiple comparisons test, *P < 0.05, **P < 0.01, #P = 0.08).

