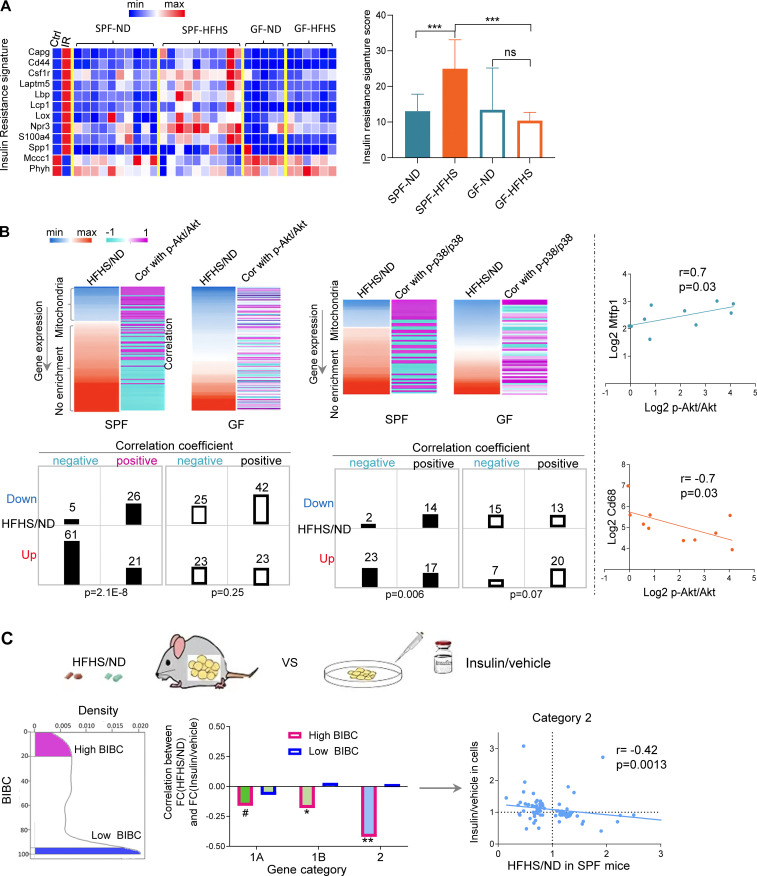
Figure 3.
Validation of network inferences revealing microbiota-dependent IR in WAT. (A) Expression levels of IR signature genes described in Jung et al. (2018) in WAT of ND or HFHS-fed SPF or GF mice (SPF mice, n = 10; GF mice, n = 5–6). (B) Heatmaps showing the fold change of gene expression (HFHS/ND) in WAT and the correlation of the gene expression levels with the abundance of phosphorylated p-Akt/Akt or p-p38/p38 in WAT in each mouse (upregulated genes by HFHS tend to negatively correlate with phosphorylated Akt and p38, while downregulated genes by HFHS tends to positively correlate with phosphorylated Akt and p38 in SPF mice; this phenomenon only holds in SPF mice). The contingency tables show the relationship between sign of correlation (indicated by + or −) and regulation by HFHS (Dn, genes downregulated by HFHS; up, genes upregulated by HFHS; +, genes positively correlated with p-Akt/Akt or p-p38/p38; −, genes negatively correlated with p-Akt/Akt or p-p38/p38, chi-square, Yates value). Scatterplots show two examples of genes demonstrating positive (Mtfp1) and negative correlation (Cd68) with p-Akt/Akt (Spearman correlation, one-tailed P value, n = 10) in WAT of SPF mice. (C) Correlation between in vivo effects of HFHS in WAT and in vitro effect of insulin in 3T3-L1 adipocyte cells on the expression of high- and low-ranking BiBC genes (left panel shows the distribution of BiBC among the DEGs in WAT; middle panel shows the correlation coefficient between fold change [HFHS/ND] in WAT and fold change [insulin/vehicle] in vitro of gene expression in each category; right panel [scatter plot] shows the correlation only in category 2 [each dot represents a gene]). Only high-ranking BiBC genes have negative correlation (Spearman correlation, one-tailed P values: *P < 0.05, **P < 0.01, #P = 0.11).

