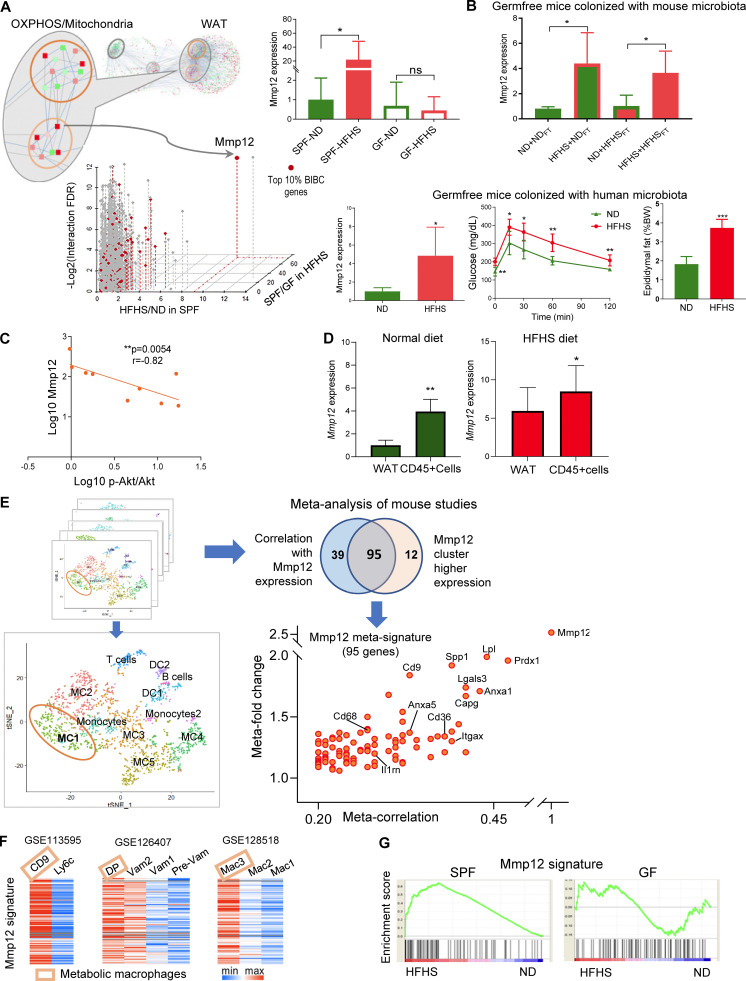
Figure 4.
Mmp12-positive macrophages link microbiota-dependent inflammation and OXPHOS damage in WAT leading to impaired glucose metabolism. (A) Identifying critical candidate genes mediating information flow from the inflammation subnetwork to the OXPHOS/mitochondria subnetwork. The scatterplot displays genes by the dimensions of: (1) BiBC between inflammatory and OXPHOS/mitochondria subnetworks (red color, top 10%); (2) fold change of gene expression induced by diet in SPF mice (HFHS/ND in SPF mice); (3) fold change of gene expression induced by microbiota in HFHS-fed mice (SPF/GF under HFHS condition); (4) log-transformed FDR of the interaction effect (diet × microbiota, two-way ANOVA). The inset bar-plot shows the intensity of Mmp12 transcripts in SPF or GF mice fed with either ND or HFHS diet (mean ± SEM, SPF mice: n = 10 per group; GF mice: n = 5, ND, n = 6, HFHS). (B) Top: Mmp12 gene expression in WAT of ND or HFHS-fed GF mice transplanted with fecal microbiota harvested from either ND or HFHS-fed SPF mice (mean ± SD, n = 4, parametric t test, one-tailed, *P < 0.05). Colors: outlines = diet and bar filling = type of microbiota used for fecal transplantation; HFHS = red, ND = green. Bottom: GF mice were transplanted with human microbiota. The figures respectively show WAT Mmp12 gene expression, glucose tolerance curve, fasting glucose levels, and epididymal fat amounts in ND or HFHS-fed mice (mean ± SD, n = 5, Mann-Whitney test, one-tailed, *P < 0.05). (C) Correlation of Mmp12 gene expression and p-Akt/Akt in adipose tissue (n = 9; Spearman correlation, one-tailed). (D) Mmp12 expression in bulk WAT and CD45+ cells isolated from WAT of SPF mice fed with ND or HFHS (mean ± SD, n = 5 for ND-fed mice, n = 7 for HFHS-fed mice, one-tailed parametric t test, *P < 0.05, **P < 0.01). (E) Meta-analysis of single cell transcriptome analysis to derive Mmp12 meta-signature in mice. Eight single-cell RNA datasets with CD45+ cells containing Mmp12+ cell subsets were used for this analysis. The meta-correlation analysis and meta-differential expression analysis from each data set (details in Materials and methods) identify a gene signature specific to subsets of Mmp12+ cells (adjusted P value <0.001); Venn diagram indicates the overlap between the two analyses, the 95 genes are shown on the scatter plot with labeling of some genes. (F) Heatmaps showing the expression of Mmp12 meta-signature genes in different types of macrophages in GSE113595, GSE126407, and GSE128518. DP, CD11c+CD64+ double-positive macrophage; VAM, vasculature associated macrophages. (G) Mmp12 meta-signature gene set is enriched by HFHS in SPF mice, but not in GF mice (SPF mice: n = 10 per group; GF mice: n = 5; ND, n = 6, HFHS).

