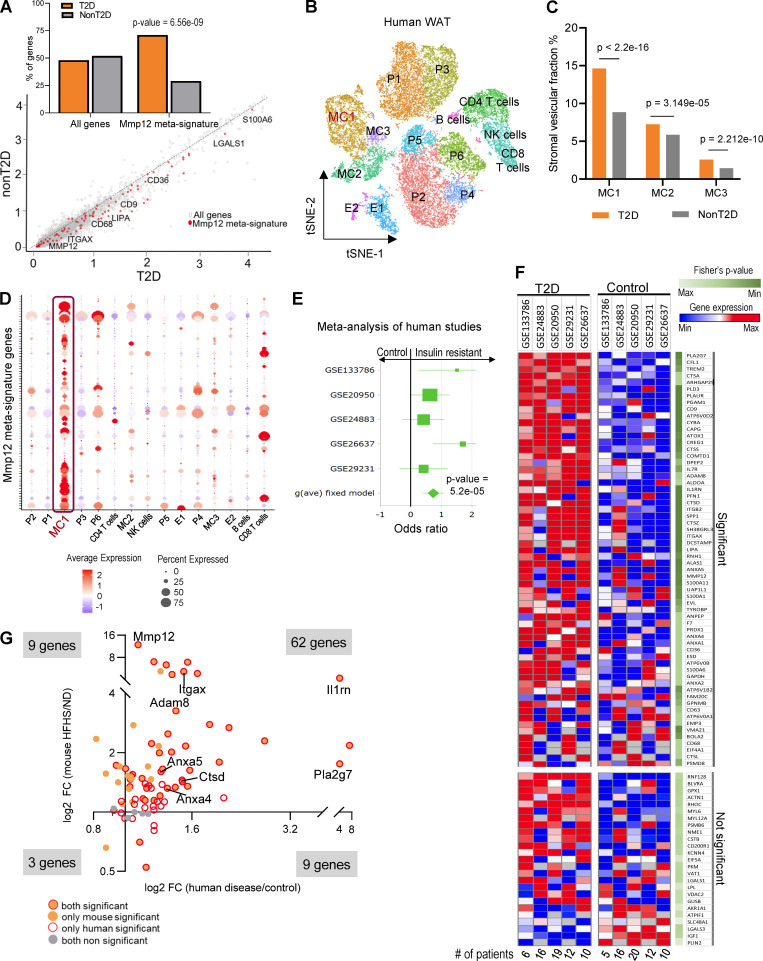
Figure 6.
MMP12-IR-ATM molecular signature in WAT is associated with IR in humans. (A) Scatter plot of log-transformed average gene expression in human visceral adipose tissue SVF (GSE129363), with a fit line and Mmp12 signature genes marked in red. Inset graph shows the percentage of genes in each group with Mmp12 meta-signature significantly higher in T2D (n = 5) vs. non-T2D (n = 9) obese patients (two-sided, Wilcoxon rank sum test with continuity correction, P < 0.0001). (B) t-SNE plot of the human scRNA-seq from adipose tissue SVF (GSE129363). Cell type names are annotated in the plots based on identified cell type specific marker genes. MC, myeloid cells; P, progenitor cells; E, endothelial cells. (C) Percentage distribution of human SVF of myeloid cell (MC) clusters in the scRNA-seq samples. Significant enrichment of MC1 cells are seen in T2D patient samples as compared to other clusters (Pearson’s chi-squared test, ****P < 0.0001). (D) Dot plot of average expression and percentage of cells with Mmp12 meta-signature enrichment in MC1 cluster cells among all clusters of the adipose tissue SVF in humans. (E) Forest plot of Hedge’s g effect size in meta-analysis of five human studies of whole tissue adipose transcriptome for the Mmp12 meta-signature genes. Studies were obtained from GEO and contained gene expression data of individuals with/without T2D. The P value shown is from the fixed effect model. See materials and methods for exclusion criteria. (F) Heatmap showing the expression of Mmp12 IR-ATM genes from meta-analysis of the human adipose tissues of insulin resistant (IR) and non-IR patients (Fisher’s P values <0.05 considered significant), each column represents mean gene expression in corresponding group of patients. (G) Fold change (FC) of Mmp12 meta-signature in human adipose tissue by diseases (T2D/control) and by diet in the WAT of mouse (HFHS/ND, n = 10 per group) (Fisher’s P value < 0.05 for human and parametric, one-tailed P value <0.05 for mouse, binomial test P = 2.2E−16).

