Figure 8.
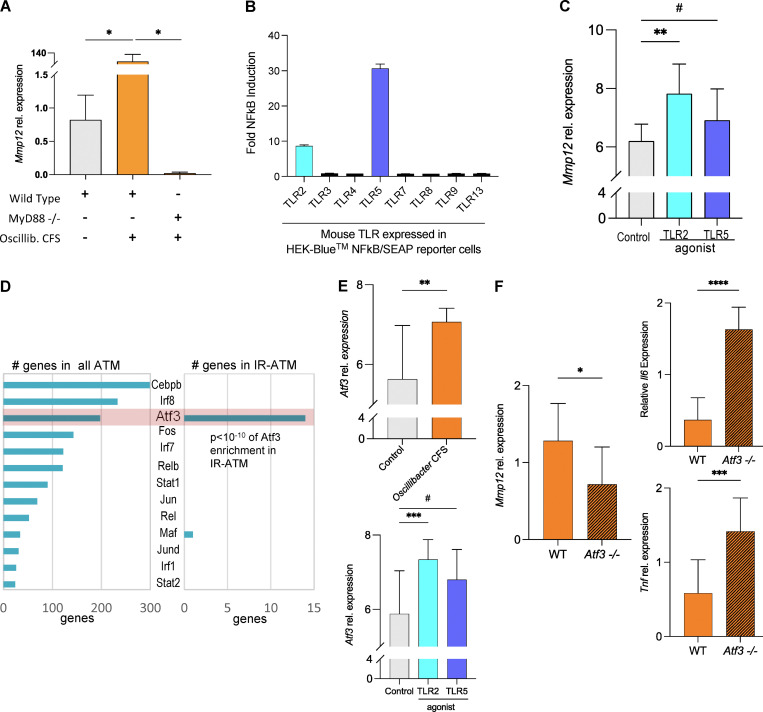
OV-derived Tlr2 ligands induce Mmp12 expression in macrophages in Myd88-and Atf3-dependent manner. (A) Relative Mmp12 gene expression measured by qPCR in WT IMM or Myd88−/− IMM treated with OV CFS (median normalized data shown as mean ± SD, n = 4 independent experiments, one-tailed Mann-Whitney test). (B) Mouse TLR agonist screen conducted by InvivoGen using single mouse TLR expressing HEK-Blue NFkB/SEAP reporter cells treated with OV CFS. Data shown as fold induction (CFS treated/control), mean ± SD of n = 3. (C) Mmp12 expression measured by qPCR in WT IMM cells treated with a TLR2 agonist, TLR5 agonist, or control. Data are median normalized and log2-transformed, shown as mean ± SD, n = 8 independent experiments, one-tailed Mann–Whitney tests were used, #P = 0.1284. (D) Atf3 as one of the top TFs regulating IR-ATMs signature. Left: The ATMs scRNA-seq GRN analysis using SCENIC predicted 38 TFs for the adipose macrophages. Right: Among the predicted TFs in IR-ATMS, Atf3 is shown to regulate 14 genes from the signature including Mmp12. (E) Atf3 expression in OV CFS (top)– or TLR2 or TLR5 agonist (bottom)–treated IMM cells. Data are median normalized and log2 transformed, shown as mean ± SD, n = 8 independent experiments, two-tailed Mann–Whitney test used, #P = 0.2113. (F) Mmp12, Il-6, and Tnf gene expression in WT (orange) and Atf3−/− (orange with lines) IMM cells treated with OV CFS. Data are median normalized relative expression levels in OV CFS–treated cells divided by PYG media (control)–treated cells, mean ± SD, n = 9 independent experiments, two-tailed (Mmp12) or one-tailed (Il6, Tnf) unpaired parametric t test used. For all experiments above: #P < 0.25, *P < 0.05, **P < 0.01, ***P < 0.001, ****P < 0.0001.

