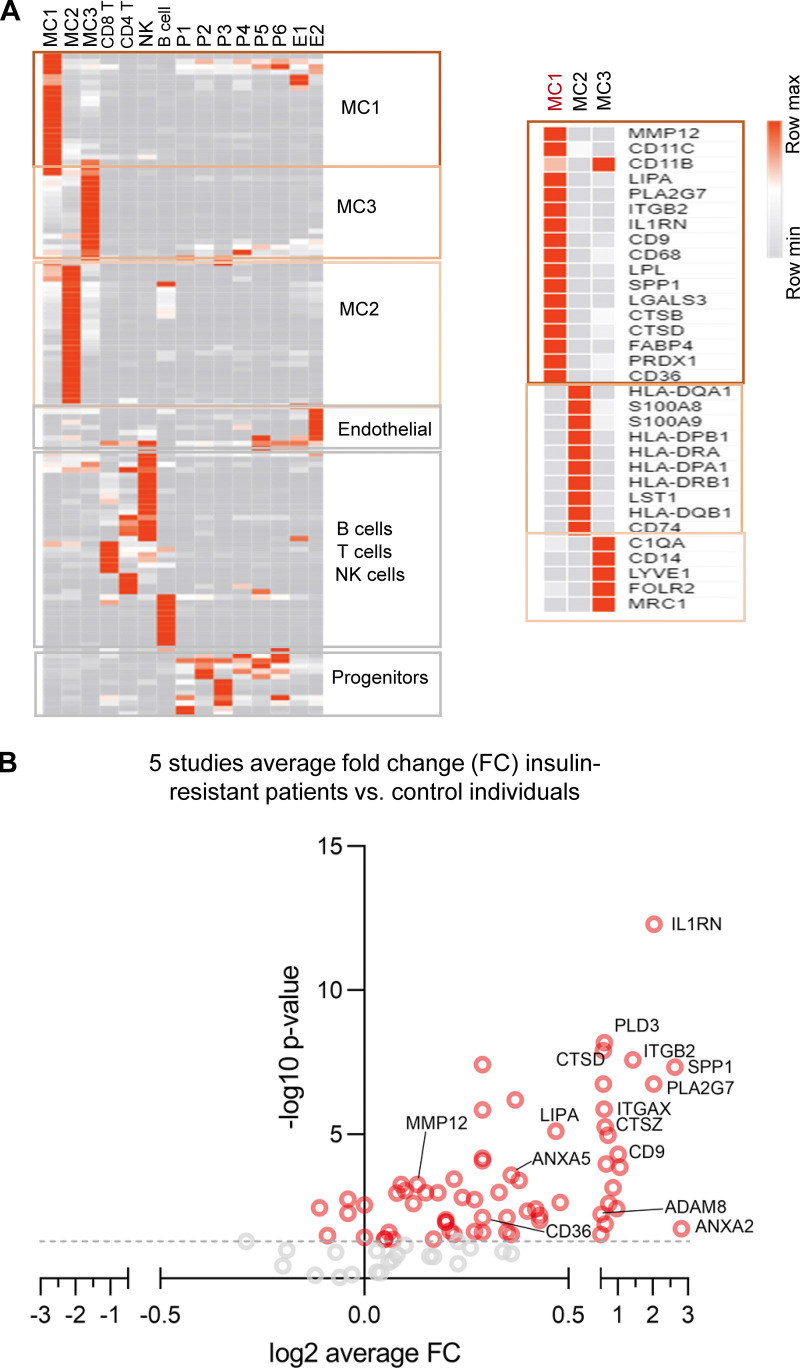
Figure S3.
MMP12/IR-ATM signature in patients with T2D. (A) Left heatmap shows the cluster markers in the human adipose tissue SVF. The color range is depicted as row max in orange to least in gray. The right heatmap shows the single cell gene expression of cluster specific markers MC1, MC2, and MC3 respectively. (B) Volcano plot of the Mmp12 meta-signature genes fold change (FC, insulin resistant patients/control) from meta-analysis of the human studies of whole tissue transcritomes.

