Figure 6.

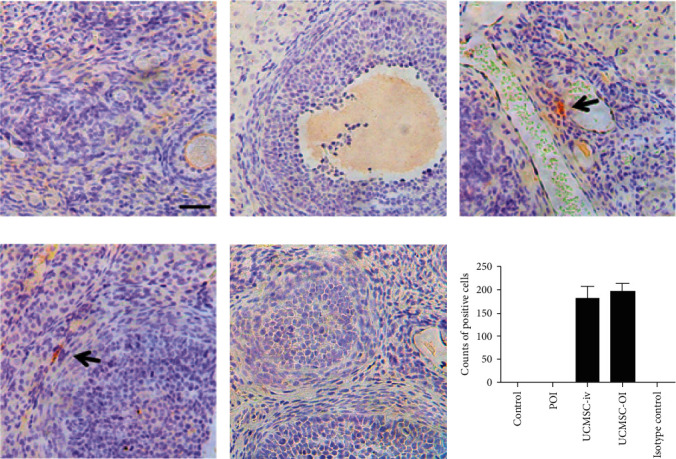
UCMSC location using IHC staining (×400). (a) Control group; (b) POI group; (c) UCMSC-iv group; (d) UCMSC-OI group; (e) isotype control: mouse IgG; and (f) counts of positive cells. Black arrow: human UCMSCs. Black scale bar = 50 μm.

UCMSC location using IHC staining (×400). (a) Control group; (b) POI group; (c) UCMSC-iv group; (d) UCMSC-OI group; (e) isotype control: mouse IgG; and (f) counts of positive cells. Black arrow: human UCMSCs. Black scale bar = 50 μm.