FIGURE 1.

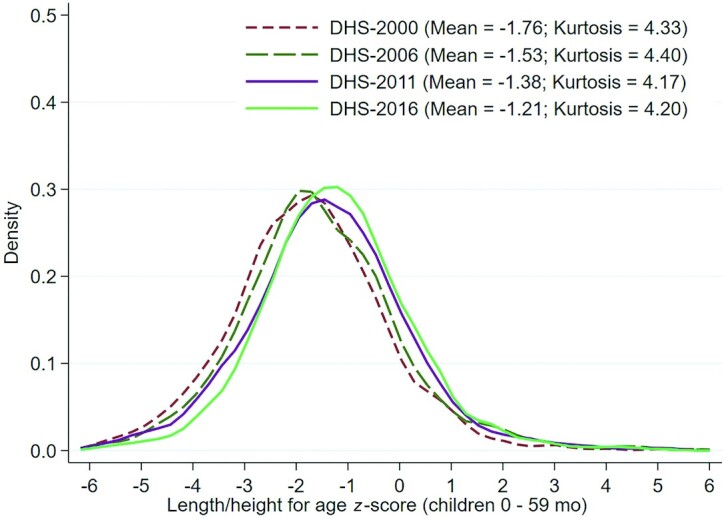
Kernel density plots representing population HAZ score distributions for 2000 (n = 5144), 2006 (n = 2367), 2011 (n = 2069), and 2016 (n = 4405) in children aged <5 y. DHS, Demographic and Health Survey; HAZ, height-for-age z-score.

Kernel density plots representing population HAZ score distributions for 2000 (n = 5144), 2006 (n = 2367), 2011 (n = 2069), and 2016 (n = 4405) in children aged <5 y. DHS, Demographic and Health Survey; HAZ, height-for-age z-score.