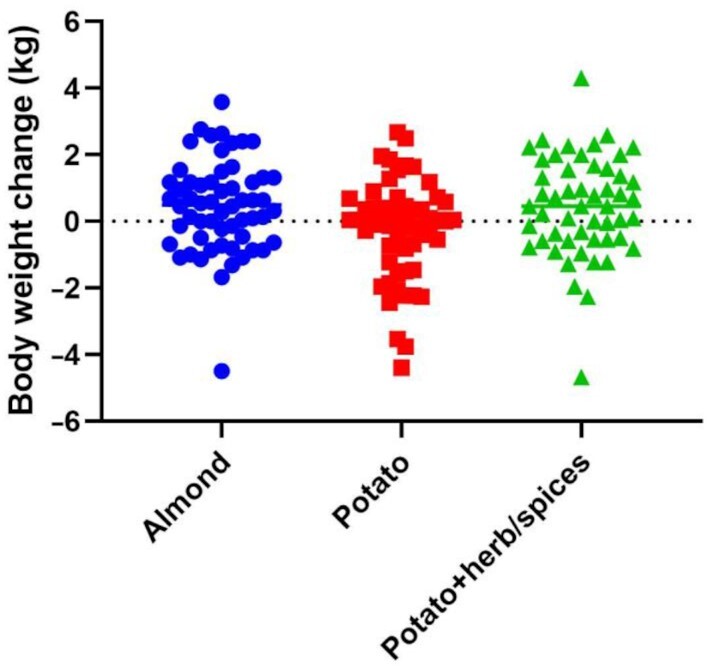
FIGURE 3.

Change in body weight. Change in the body weight (in kg) measured between baseline and study completion. Groups: almond—circles (n = 58); potato—squares (n = 55); potato + herb/spices—triangles (n = 52). Individual data shown in each diet treatment group. ANCOVA adjusted for age, gender, and baseline BMI: P = 0.014.
