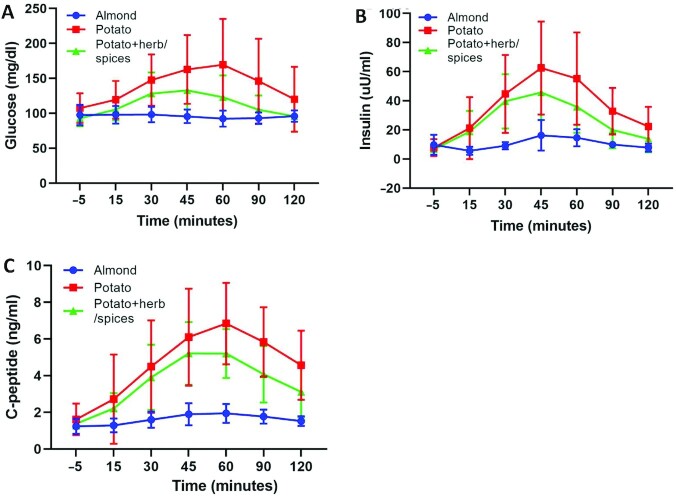
FIGURE 5.
Meal-based tolerance test. Glucose (mg/dL) (A). Insulin (uU/mL) (B). C-peptide (ng/mL) postprandial measures collected during a meal-based tolerance test following consumption of the group-assigned food item (C). Groups: Almond—circles; potato—squares; potato + herb/spices—triangles; (n = 5/treatment group; means ± SDs. ANCOVA adjusted for age, gender, and baseline BMI: AUC for glucose, P = 0.054; insulin, P = 0.008; C-peptide, P = 0.001. AUC, area under the curve.

