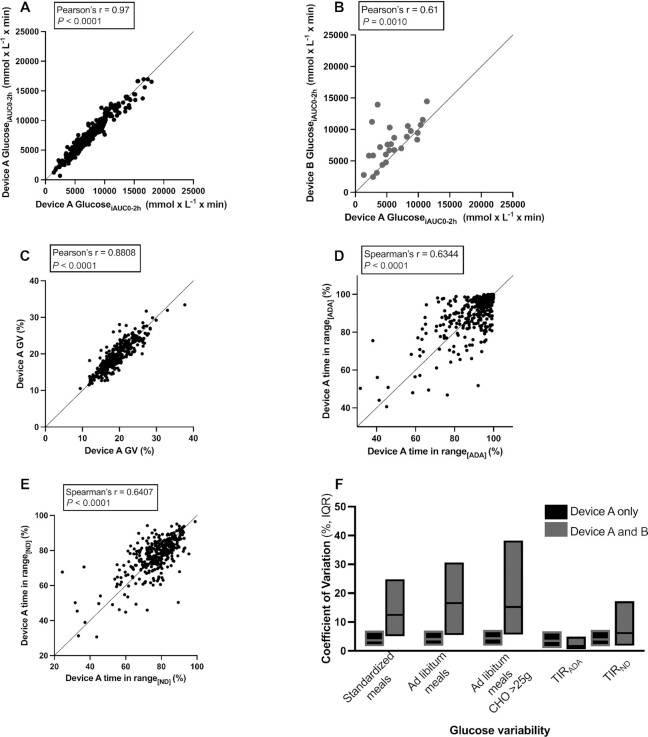
FIGURE 1.
Correlation and concordance of glucose variability obtained from 2 CGM devices worn in parallel. (A, B) Pearson's correlation of glucoseiAUC0–2 h readings in response to ad libitum meals with high carbohydrate content (>25 g CHO), obtained from 2 (A) intrabrand (n = 338) and (B) interbrand (n = 26) CGMs. (C) Pearson's correlation of short-term GV in the form of glucose CV, from 2 intrabrand CGMs (n = 342). (D) Pearson's correlation of TIRADA from 2 intrabrand CGMs (no values in data set <40%, n = 342). (E) Pearson's correlation of TIRND from 2 intrabrand CGMs (no values in data set <20%, n = 342). (F) CV of glucoseiAUC0–2 h for standardized meals (n = 359 intrabrand pairs; n = 34 interbrand pairs), for ad libitum meals (n = 351 intrabrand pairs; n = 30 interbrand pairs), and for meals containing >25 g CHO (n = 338 intrabrand pairs; n = 26 interbrand pairs), as well as CVs for TIRND and TIRADA for paired intrabrand (n = 355) and interbrand (n = 33) CGMs. (A–E) Lines of x = y identity are presented. CGM, continuous glucose monitor; CHO, carbohydrate; glucoseiAUC0–2 h, incremental area under the glucose curve between 0 and 2 h; GV, glycemic variability; TIRADA, time in range according to American Diabetes Association cutoffs; TIRND, time in range according to nondiabetic adjusted cutoffs.

