
FIGURE 2.
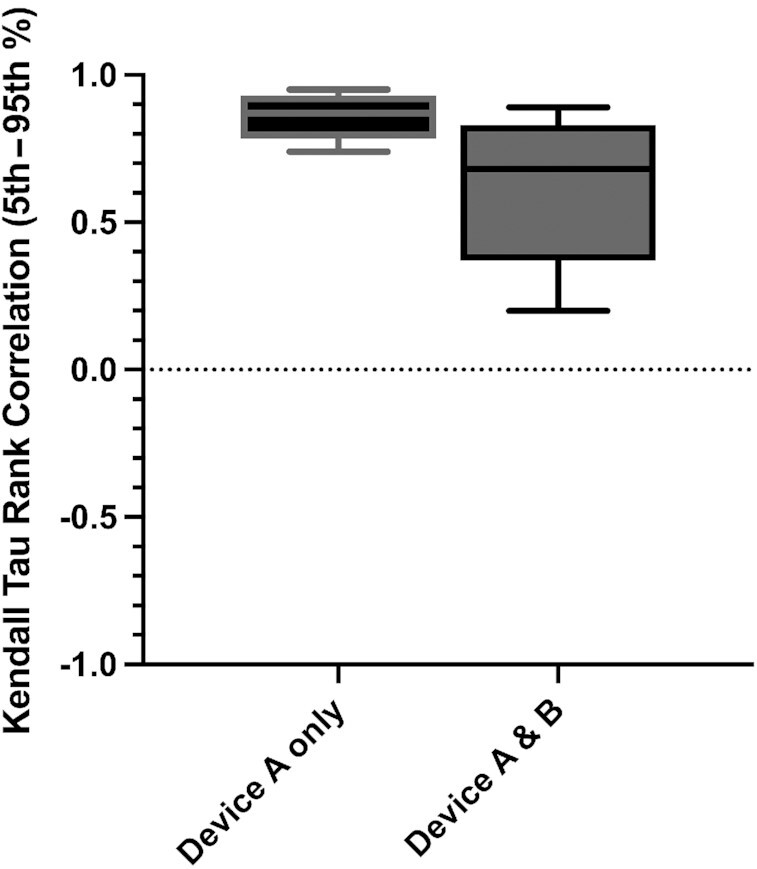
Kendall τ rank correlation of incremental area under the glucose curve between 0 and 2 h obtained from paired intrabrand (n = 359 subjects, 4406 meals) and interbrand (n = 34 subjects, 356 meals) continuous glucose monitors. Top and bottom barriers of boxes represent the interquartile range; the central line represents the median; the top and bottom brackets represent the maximum and minimum respectively.