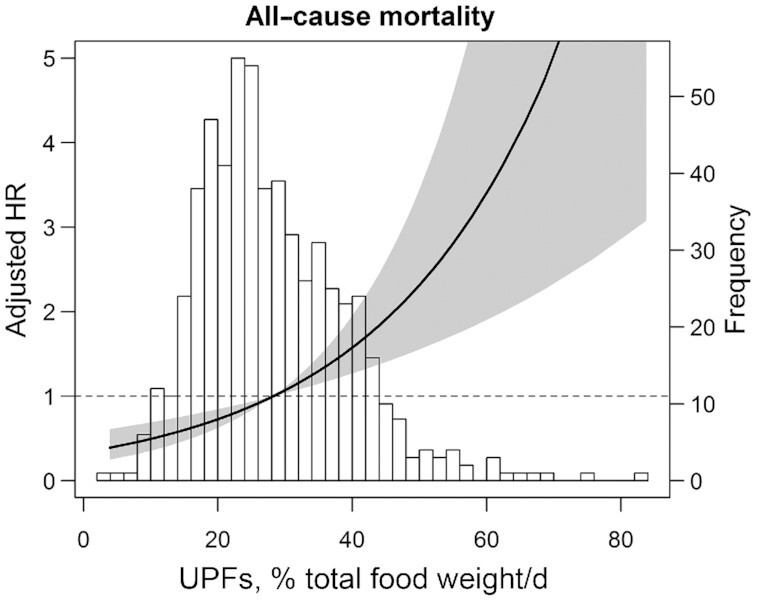
FIGURE 2.

Association of UPFs (percentage of total food weight in g/d) and all-cause mortality in 632 renal transplant recipients. Data were fit by a Cox regression model based on penalized splines and adjusted for age, sex, time between transplantation and baseline, estimated glomerular filtration rate, urinary protein excretion, primary renal disease, donor age, total energy intake, alcohol consumption, smoking status, and physical activity. The black line represents the HR, whereas the gray area represents the 95% CI. The HRs were plotted relative to a value of 1.0 for the median value of UPFs as a reference. A histogram of the distribution of UPFs is plotted in the background. UPF, ultra-processed food.
