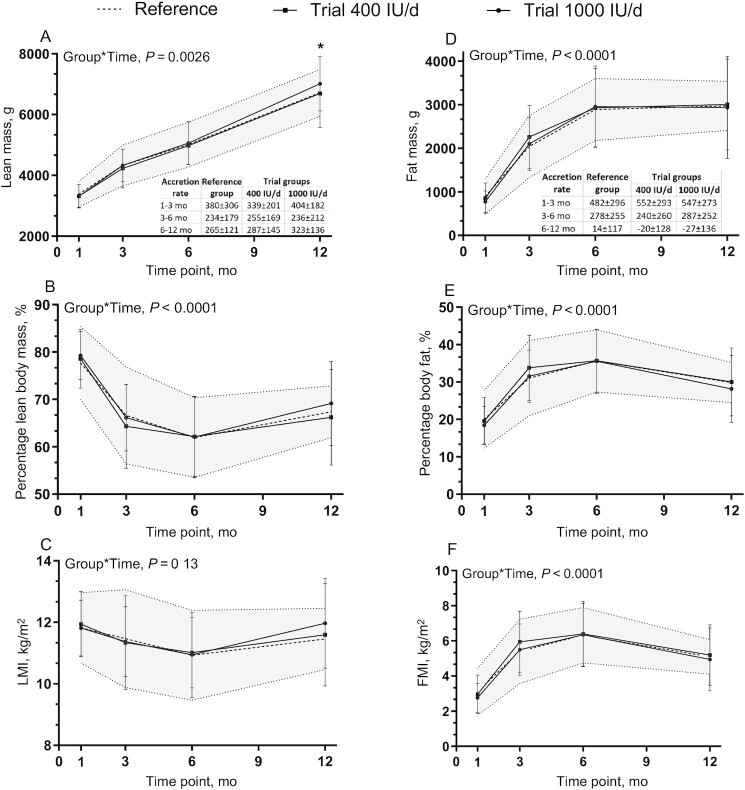
FIGURE 2.
Infant body composition over time. (A) Lean mass and lean mass accretion, (B) percentage lean mass, (C) LMI, (D) fat mass and fat mass accretion, (E) percentage fat mass, and (F) FMI among groups over time. Data are mean ± SD. Sample sizes are as follows: reference group (baseline, n = 39; 3 mo, n = 34; 6 mo, n = 34; 12 mo, n = 30); 400 IU/d group (baseline, n = 49; 3 mo, n = 43; 6 mo, n = 39; 12 mo, n = 30); and 1000 IU/d group (baseline, n = 49; 3 mo, n = 44; 6 mo, n = 41; 12 mo, n = 37). Data were compared using a mixed-effect model (SAS PROC MIXED) for fixed effects of group × time, sex, skin tone, infant actual age at each visit, gravida, parental age at delivery, maternal BMI preconception, and family income. Participant (ID) modeled as a random effect. P values reflect Tukey's post hoc tests with Tukey-Kramer adjustment for multiple comparisons. The shaded area reflects reference ± SD. *P < 0.05, 1000 IU/d group compared with 400 IU/d group at 12 mo for lean mass; no other differences between groups over time were observed. FMI, fat mass index; LMI, lean mass index.

