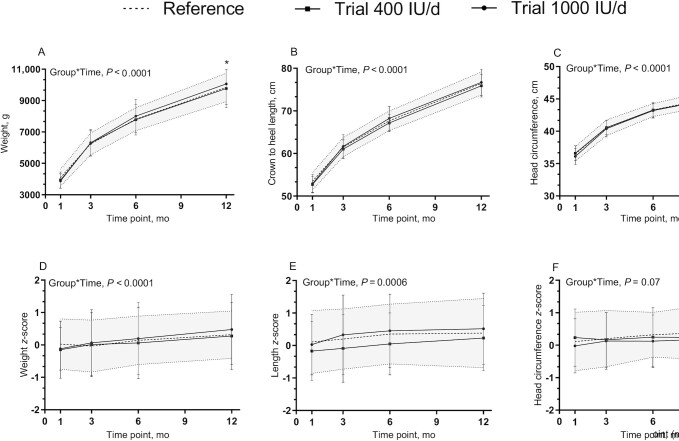
FIGURE 3.
Infant growth over time. (A) Weight, (B) crown to heel length, and (C) head circumference measurements, (D) weight-for-age, (E) length-for-age, and (F) head-circumference-for-age z scores, among groups over time. Data are mean ± SD. Sample sizes are as follows: reference group (baseline, n = 41; 3 mo, n = 35; 6 mo, n = 34; 12 mo, n = 32); 400 IU/d group (baseline, n = 49; 3 mo, n = 44; 6 mo, n = 40; 12 mo, n = 36); and 1000 IU/d group (baseline, n = 49; 3 mo, n = 44; 6 mo, n = 43; 12 mo, n = 42). Data were compared for weight, length, and head circumference measurements using a mixed-effect model (SAS PROC MIXED) tested for fixed effects of group × time, sex, skin tone, infant actual age at each visit, gravida, parental age at delivery, maternal BMI preconception, and family income. Participant (ID) modeled as a random effect; and for weight-, length-, and head-circumference-for-age z scores sex and infant actual age at each visit were removed from the mixed model. P values reflect Tukey's post hoc tests with Tukey-Kramer adjustment for multiple comparisons. The shaded area reflects reference ± SD. *P < 0.05, 1000 IU/d compared with 400 IU/d at 12 mo for body weight; no other differences in growth between groups over time were observed.

