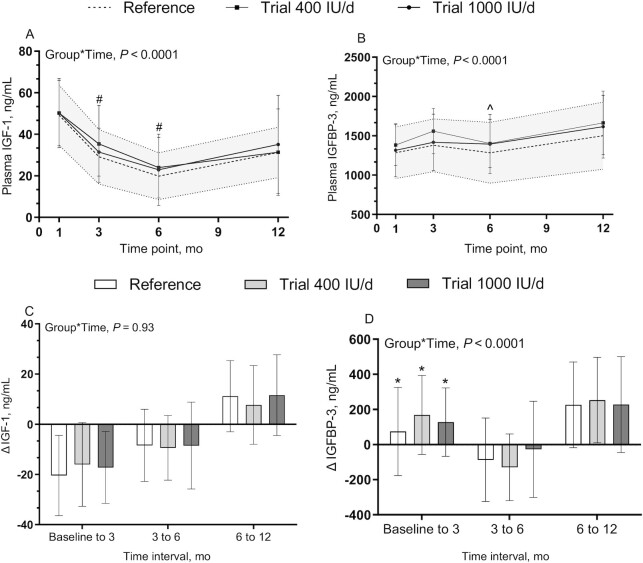
FIGURE 5.
Infant plasma IGF-1 (A), IGFBP-3 concentrations (B), Δ IGF-1 (C), and Δ IGFBP-3 (D). Data are mean ± SD. Sample sizes are as follows: reference group (baseline, n = 41; 3 mo, n = 35; 6 mo, n = 34; 12 mo, n = 32); 400 IU/d group (baseline, n = 49; 3 mo, n = 44; 6 mo, n = 40; 12 mo, n = 36); and 1000 IU/d group (baseline, n = 49; 3 mo, n = 44; 6 mo, n = 43; 12 mo, n = 42). Data were compared using a mixed-effect model (SAS PROC MIXED) tested for fixed effects of group × time, sex, skin tone, infant actual age at each visit, gravida, parental age at delivery, maternal BMI preconception, and family income. Participant (ID) modeled as a random effect. P values reflect Tukey's post hoc tests with Tukey-Kramer adjustment for multiple comparisons. The shaded area is reference ± SD. #P < 0.05, baseline compared with 3 mo and 6 mo for all groups; ^P < 0.05, 3 mo compared with 6 mo for all groups except trial 1000 IU/d; *P < 0.05, baseline to 3 mo compared with 3 mo–6 mo for all groups. IGFBP-3, insulin-like growth factor binding protein 3; IGF-1, insulin-like growth factor 1.

