
FIGURE 5.
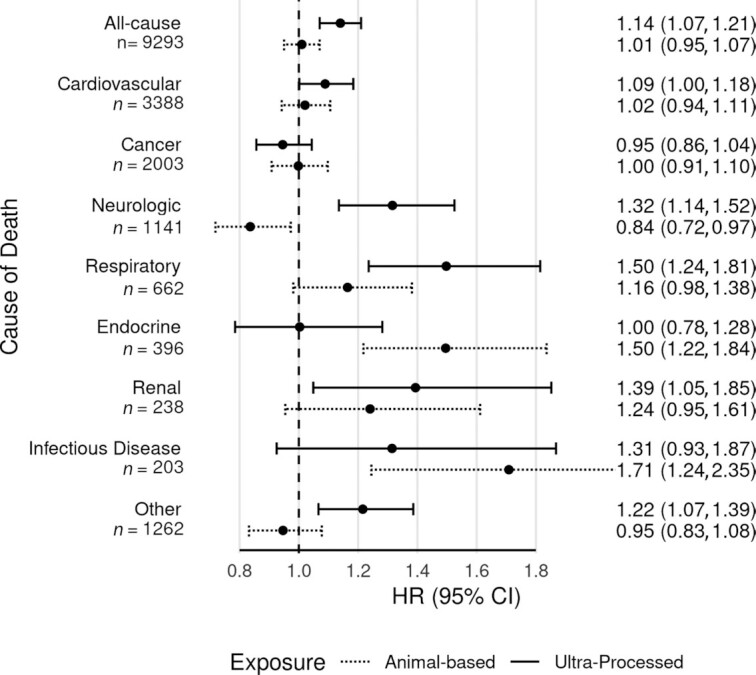
Ultra-processed food intake and animal-based food intake and cause-specific mortality. Fully adjusted HRs and 95% CIs for ultra-processed food intake and animal-based food intake and all-cause and cause-specific mortality, from Cox proportional hazards regression (n = 77,437). Results with solid lines are for the proportion of dietary energy from ultra-processed foods. Results with dotted lines are for the proportion of dietary energy from animal-based foods (meats, dairy, eggs). Results are from continuous linear models, comparing the 90th and 10th percentiles of intake (47.7% compared with 12.1% dietary energy from ultra-processed foods; 25.0% compared with 0.4% dietary energy from animal-based foods). Both dietary exposures were mutually adjusted and in addition adjusted for age (i.e., attained age as time variable), sex (male, female), race (black, nonblack), geographic region (West, Northwest, Mountain, Midwest, East, South), education (up to high school graduate, trade school/some college/associate degree, bachelor degree, graduate degree), marital status (married/common-law, never married, widowed, divorced/separated), smoking (current smoker, quit <1 y, quit >1–5 y, quit >5–10 y, quit >10–20 y, quit >20–30 y, quit >30 y, never smoked), alcohol [nondrinker, rare drinker (<1.5 servings/mo), monthly drinker (1.5 to <4 servings/mo), weekly drinker (4 to <28 servings/mo), daily drinker (≥28 servings/mo)], exercise (i.e., “vigorous activities, such as brisk walking, jogging, bicycling, etc., long enough or with enough intensity to work up a sweat, get your heart thumping, or get out of breath”) (none, ≤20 min/wk, 21–60 min/wk, 61–150 min/wk, ≥151 min/wk), sleep duration (≤4 h/night, 5 to ≥9 h/night), menopause (in women) [premenopausal (including perimenopausal), postmenopausal], hormone replacement (in postmenopausal women) (not taking hormone replacement, taking hormone replacement), BMI (in kg/m2) [restricted cubic spline with knots at the 5th (19.7), 27.5th (23.4), 50th (26.1), 72.5th (29.4), and 95th (38.6) percentiles], total dietary energy (kcal/d), prevalent CVD (coronary bypass, angioplasty/stent, carotid artery surgery, heart attack, or stroke; or angina pectoris or congestive heart failure treated in the last 12 mo) (yes, no), and diabetes mellitus active or treated in the last 12 mo (yes, no). ICD-10 codes for the underlying cause of death were used to classify cause-specific mortality as follows: CVD deaths starting with I; cancer deaths starting with C; neurologic deaths starting with G and including F01–F03; respiratory deaths starting with J; endocrine deaths with E; renal deaths with N; infectious disease deaths starting with A or B; and other deaths included all other ICD codes. The most common causes of death within each category were as follows: cardiovascular (atherosclerotic heart disease, myocardial infarction, stroke); cancer (lung, pancreatic, colon, breast, prostate); neurologic (Alzheimer dementia, unspecified dementia, Parkinson disease); respiratory (pneumonia, chronic obstructive pulmonary disease, pulmonary fibrosis); endocrine (diabetes, hyperlipidemia); renal (urinary tract infection, chronic kidney disease, kidney failure); infectious disease (sepsis, Clostridium difficile colitis, hepatitis C); and other (ill-defined or unknown cause, myelodysplastic syndrome, liver cirrhosis). CVD, cardiovascular disease; ICD-10, International Statistical Classification of Diseases, 10th Revision.