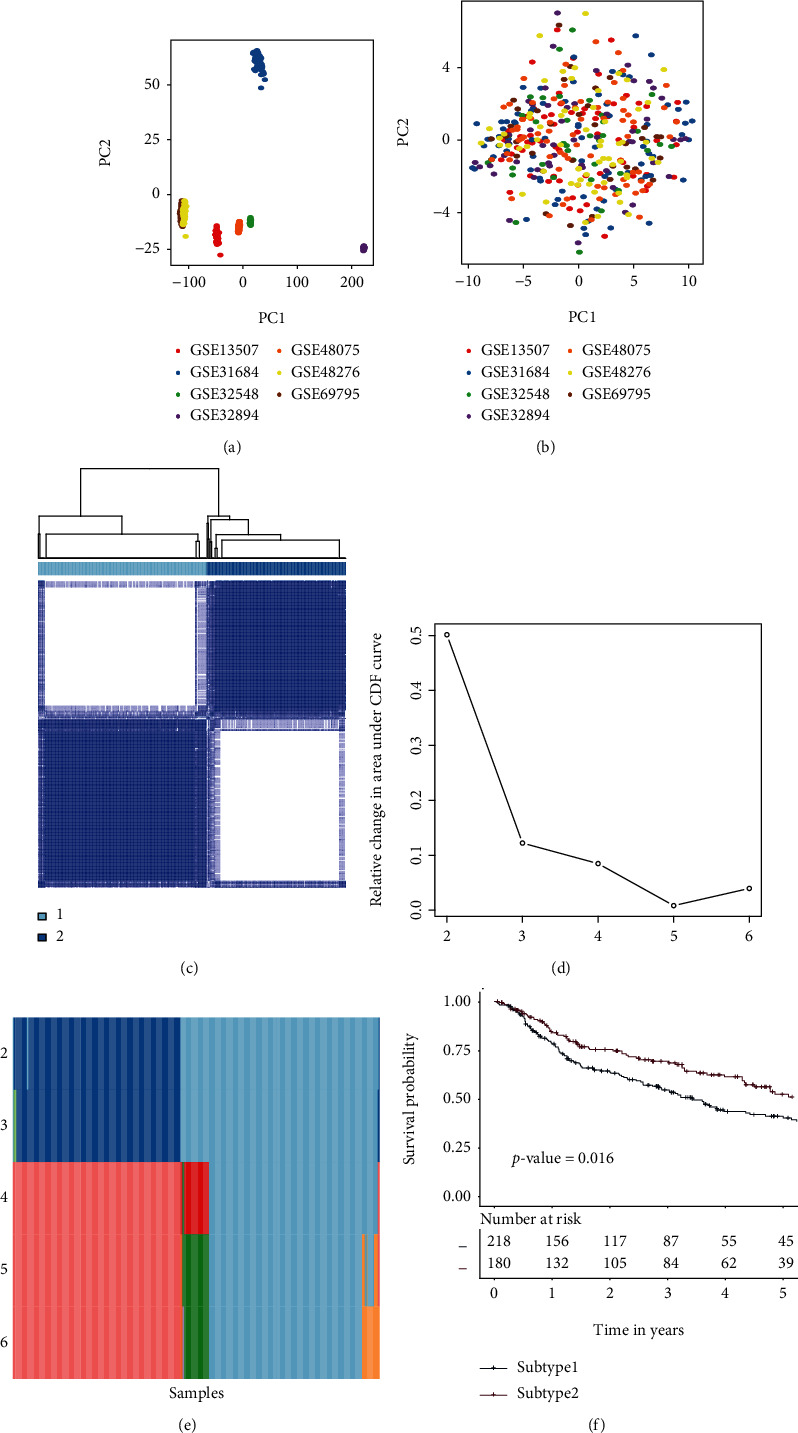
Figure 1.

Consensus clustering for MIBC discovery datasets (GSE13507, GSE31684, GSE32548, GSE32894, GSE48075, GSE48276, and GSE69795). (a) PCA of the mRNA expression matrix of 7 discovery datasets. (b) PCA of the TME gene set matrix of 7 discovery datasets. (c) Consensus matrix heatmap of two subtypes. (d) Relative change area values for optimal subtype numbers: 2 to 6. The optimal subtype number in this plot should be the one at which the value starts to drop. (e) The sample distributions from different subtype numbers. The samples in each subtype were illustrated by distinct colors within every row. (f) Subtype-specific survival curves for five-year OS in individuals with MIBC. The log-rank test was used to determine the p value among the TME subtypes. Abbreviations: OS: overall survival; MIBC: muscle invasive bladder cancer; PCA: principal component analysis; TME: tumor microenvironment.
